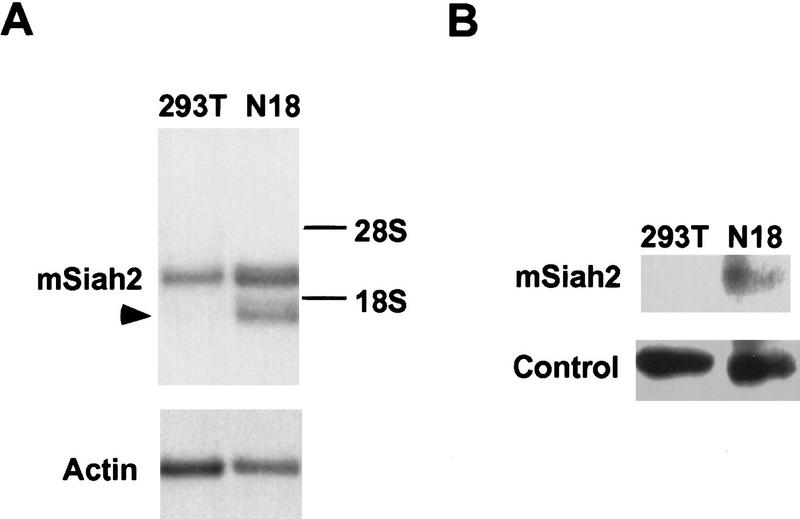
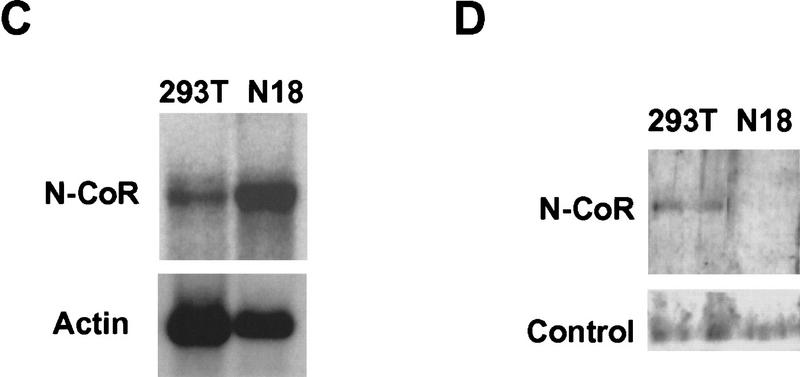
Figure 4.
Cell specificity of mSiah2 and N-CoR expression. Northern analysis of mSiah2 (A) and N-CoR (C) mRNA expression. Actin hybridization is shown as loading control. (Arrowhead in A) mSiah2 mRNA species present in N18 cells and absent from 293T cells. Immunoblot analysis of mSiah2 (B) and N-CoR (D) proteins. Total protein (400 μg in B; 200 μg in D) was anlayzed, and equal loading and transfer to nitrocellulose was determined by Ponceau S stain (not shown). Rabbit antiserum used was raised against Sina, but similar results were obtained with antisera of lower titer raised against mSiah2. (B, control) Unidentified protein band (∼42 kD) detected by the Sina antiserum in both N18 and 293T cells. The mSiah2 band comigrated with the in vitro-translated standard (not shown) at ∼36 kD. (D, control) Unidentified protein band (∼215 kD) detected by the N-CoR antiserum in both N18 and 293T cells. The N-CoR band comigrated with in vitro-translated standard (not shown) at ∼270 kD.


