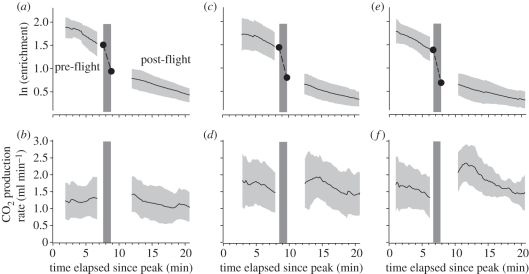
Figure 1.
Elimination of 13CO2 from the body bicarbonate pool (note logarithmic scale) and rate of CO2 production (ml min−1) in Carollia sowelli in relation to time elapsed since peak enrichment ((a,b) dry; (c,d) wet + no rain; (e,f) wet + rain). Solid lines depict means and light grey areas the range of ± one standard deviation. Dashed lines indicate the fractional turnover of flying bats based on extrapolated 13C enrichments at the onset and end of the flight period (dark grey rectangle, flight period).

