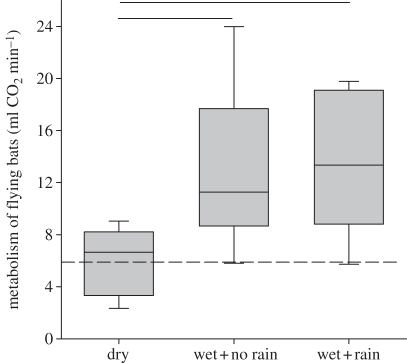
Figure 2.
Metabolic rates (ml CO2 min−1) of flying Carollia sowelli when either exposed to dry conditions, wet fur and no rain, or wet fur and rain. Box margins indicate the 25 and 75 percentiles, whiskers the five and 95 percentiles, the centre line of the box the median. Significant differences between treatments are indicated by horizontal lines. The dashed line marks the predicted flight metabolism.

