
Figure 2.
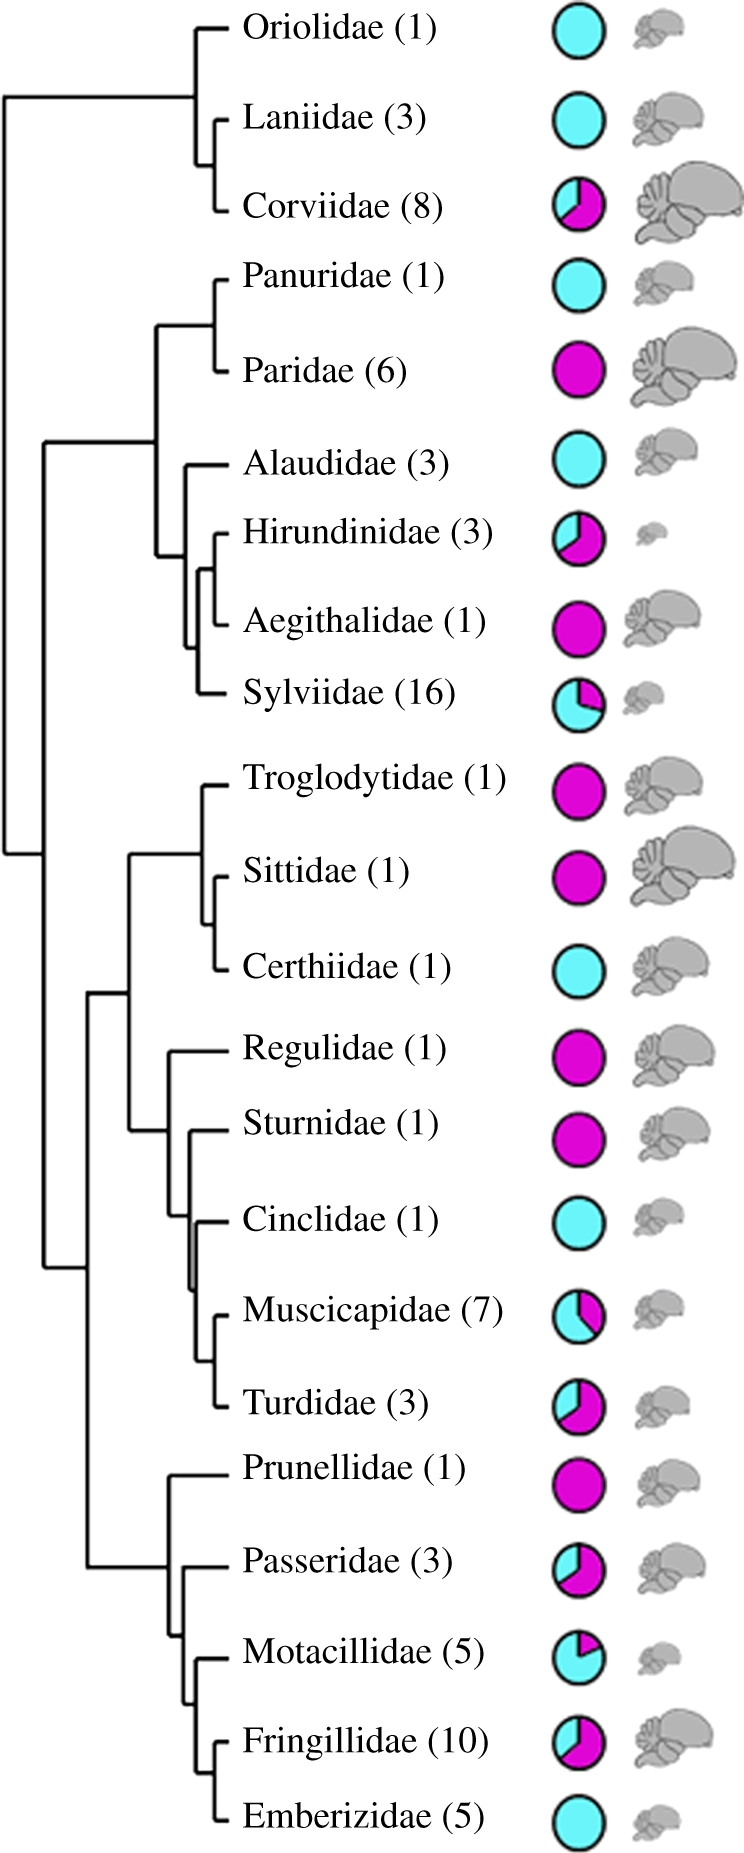
Phylogenetic tree describing the relationship between 22 avian families studied (number of included species per family in parentheses). The pie charts indicate the proportion of urban dwellers (purple colour) versus urban avoiders (blue colour) among species within each family. The schematic of the avian brain is scaled to match the relative mean brain size for each family.