
Figure 1.
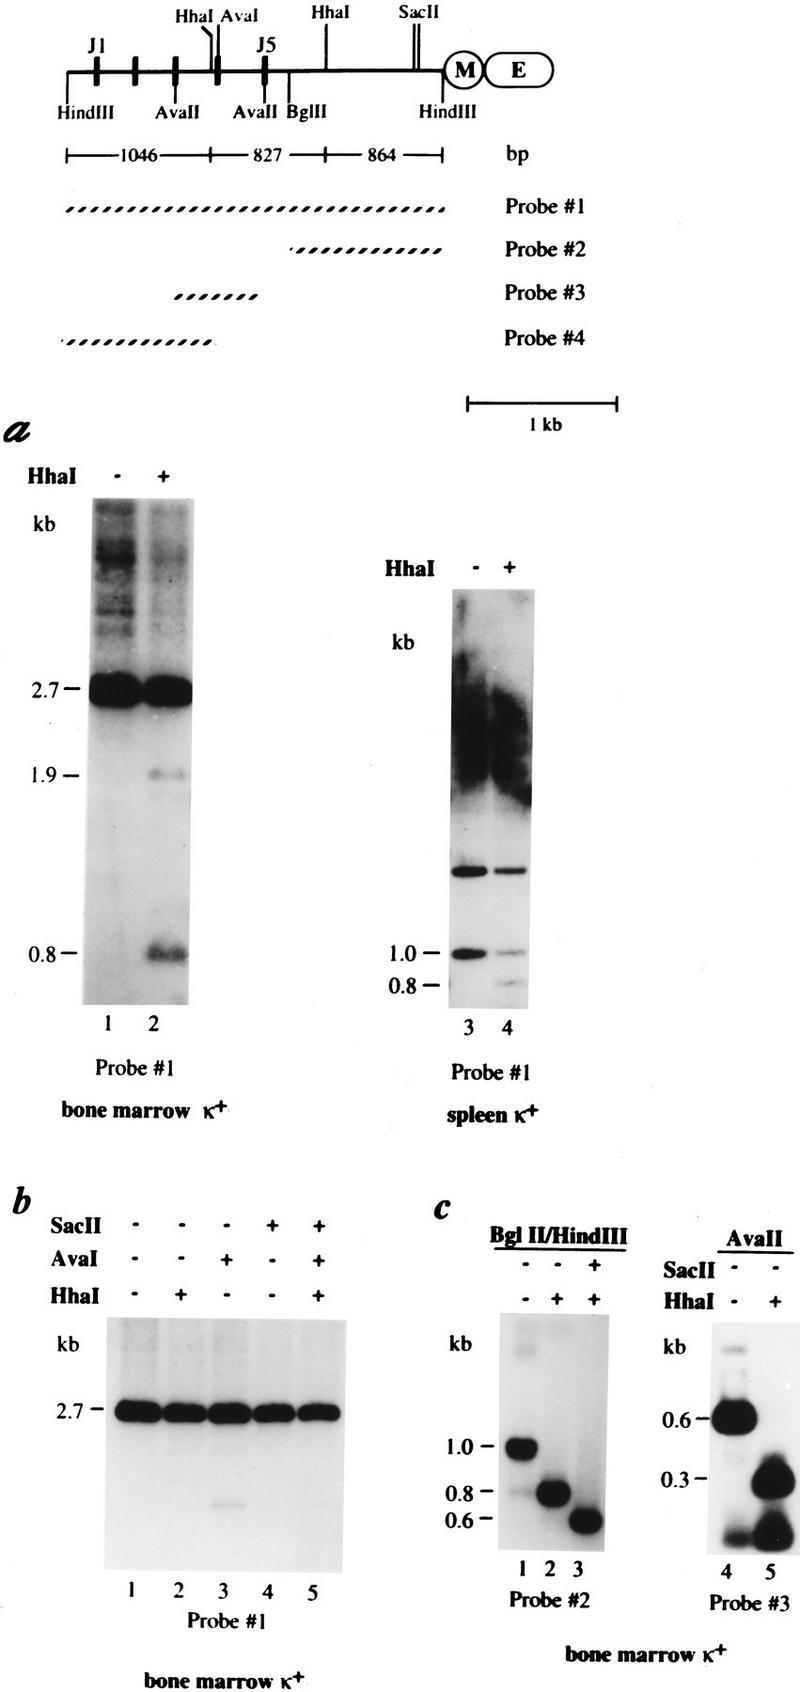
In vivo methylation pattern of the κ chain gene. A map of the κ chain gene locus shows the J segments, the intronic MAR (M) and enhancer (E) sequences, the relevant restriction sites, fragment sizes, and the probes used in these experiments. (a) DNA from bone marrow (lanes 1,2) or spleen (lanes 3,4) κ+ cells derived from wild-type mice was digested with HindIII (lanes 1–2) or HindIII–BglII (lanes 3–4) and then tested for methylation by additional restriction with HhaI (+). These samples were then subjected to gel electrophoresis and analyzed by blot hybridization using probe 1. It should be noted that equal amounts of DNA were loaded in both lanes 1 and 2 as indicated by ethidium bromide staining (data not shown). When cut with HindIII the bone marrow DNA shows a germ-line band (2.7 kb) as well as numerous rearranged bands (seen as a smear). Full undermethylation results in 1046-, 827-, and 864-bp fragments, but partial digests can also be seen on the gel (1.6 and 1.9 kb). It should be noted that the appearance of a 1.9-kb band indicates that a small fraction of the germ-line allele is also unmethylated at some sites. Similar results were seen when DNA from κ+ spleen cells was analyzed in the same manner (data not shown). Digestion with HindIII–BglII concentrates all κ gene copies into a single band (1.0 kb), which if unmethylated is reduced to 0.8 kb when cleaved with HhaI. This site is ∼50% methylated in normal κ+ cells (lane 4). In this gel, the 1.0-kb band has a lower intensity than the 1.7-kb band, mainly because it hybridizes to a smaller part of the probe and because gel transfer is not as efficient at this molecular weight (as shown by analysis of HindIII–BglII digests of non-B-cell DNA). The upper (1.7-kb) band seen in this gel represents the 5′ HindIII–BglII fragment derived from germ-line copies of the gene. (b) DNAs from κ+ bone marrow cells were treated with HindIII and further digested with the methyl-sensitive restriction enzymes, HhaI, AvaI, or SacII and analyzed as in a. (c) Because the degree of undermethylation on the rearranged κ alleles could not be determined quantitatively from the data shown in Figure 1a, DNA was extracted (Quiagen Kit) from the smear region (>2.7 kb; a, lane 1), further digested with either BglII (lanes 1–3) or AvaII (lanes 4,5) plus methyl-sensitive restriction enzymes SacII or HhaI (indicated by a + or − at the top), and analyzed using either probe 2 or probe 3, as indicated. The resulting BglII–HindIII fragment (region covered by probe 2) yielded a 0.8- or 0.6-kb band when the respective HhaI and SacII sites are unmethylated. The AvaII fragment (region covered by probe 3) was cleaved by HhaI to yield a 0.3-kb band if unmethylated.