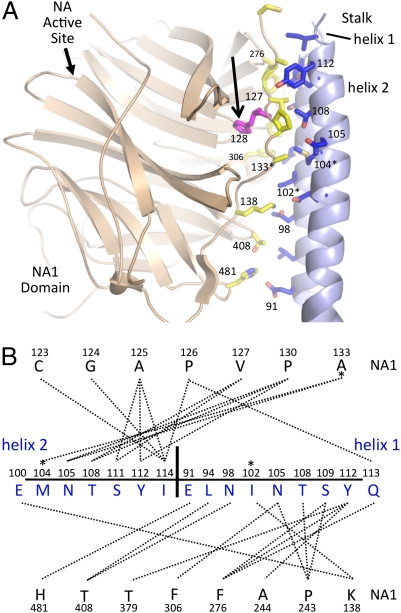
Fig. 5.
Functional mutations map to the NA to stalk interface. (A) An expanded view of a single NA domain to stalk interface is shown between the NA1 domain (beige) and stalk helices from two subunits (h1 and h2; light blue). Interface residues are shown in stick format, with oxygen atoms colored red and nitrogen atoms colored dark blue. Interface residues in the NA1 domain have carbon atoms colored yellow. Residues in the stalk domain have carbon atoms colored blue. Residue H128, implicated in NDV virulence, is shown in magenta and highlighted with an arrow. (B) Contact map between the NA1 domain and h1/h2 helices generated with the program MONSTER (36). NA1 domain residues are shown above and below a line of h1/h2 stalk residues. Residues in the stalk helices from the two subunits (h1/h2) are separated by a vertical line and indicated. Mutations of residues in this interface (102, 104, and 133) that affect HN NA and fusion activities (Table 1, category IIC) are indicated by asterisks in both A and B. I133 and L244 were truncated to alanine in the model.

