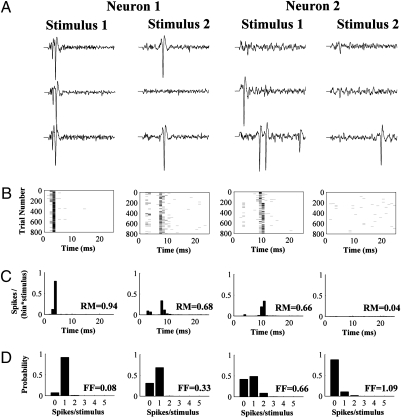
Fig. 1.
Discrimination of stimulus location by pairs of VPM neurons. (A) Representative raw single-trial responses (25 ms poststimulus) of a pair of VPM neurons (neuron 1 and neuron 2) to stimulation of two different locations on the whisker pad (stimulus 1 and stimulus 2). (B) Raster plots showing the single-trial responses of the same pair of neurons for all 800 trials per stimulus location. (C) Peri-stimulus time histograms (PSTH) showing the average responses to the stimuli of the same pair of neurons. The response magnitude (RM, average spikes per stimulus) is reported for every PSTH. The x axis (time) is the same for all plots in A–C, with 0 being stimulus onset. (D) Spike-count distributions (probability of occurrence of a particular number of spikes per stimulus in any given trial), corresponding to the responses in A–C. The Fano factor (FF) is reported for every spike-count distribution.

