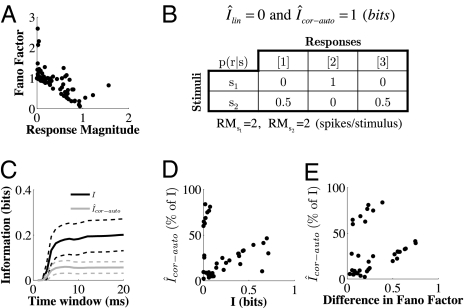
Fig. 2.
Trial-to-trial response variability contributes to the information conveyed by single neurons. (A) Scatter plot of the response magnitude (x axis, average spikes per stimulus) versus the Fano factor (y axis) for all neurons (40) and all stimuli (2). (B) Simple example of a neuron carrying information about two stimuli only by count autocorrelations. The neuron fires always with two spikes in response to the first stimulus and either one spike or three spikes (50% of the trials) in response to the second stimulus. Shown is the conditional probability p(r | s) of the responses to the stimuli and the corresponding information values, assuming that p(s1) = p(s2) = 0.5. (C) Total information (Itot, black line) carried by single neurons about stimulus location and contribution of trial-to-trial response variability, i.e., information due to count autocorrelations (Îcor-auto, gray line). The x axis represents poststimulus time, and information values are calculated for increasing time windows [(0–1 ms), (0–2 ms), … , (0–20 ms)]. The y axis represents information in bits. Solid lines are averages across neurons; dashed lines are 95% confidence intervals. (D) Scatter plot of the information due to count autocorrelations (Îcor-auto, y axis, expressed as percentage of the total information) versus the total information (I, x axis, in bits) considering the entire (0–20 ms) poststimulus window. (E) Scatter plot of the information due to count autocorrelations (Îcor-auto, y axis, expressed as percentage of the total information) versus the difference in Fano factor between stimuli (x axis).

