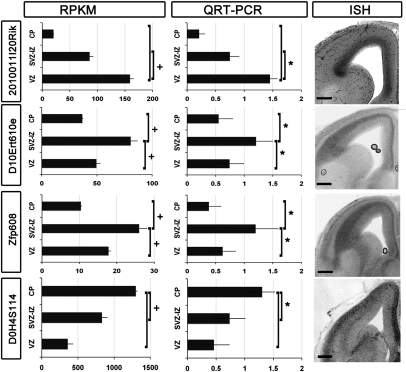
Fig. 2.
Verification of zone-specific genes. A row of three panels is shown for every gene named on the left side. The first panel shows mean RPKM expression levels (±SEM). Significance is based on pairwise comparisons and bhp < 10−5 (+). The second column of graphs shows qRT-PCR on RNA isolated by LMD from E14.5 cryosections. Mean fold change (±SEM) is plotted for every cellular zone (*P < 0.001). The third column shows ISH on E14.5 mouse sections.

