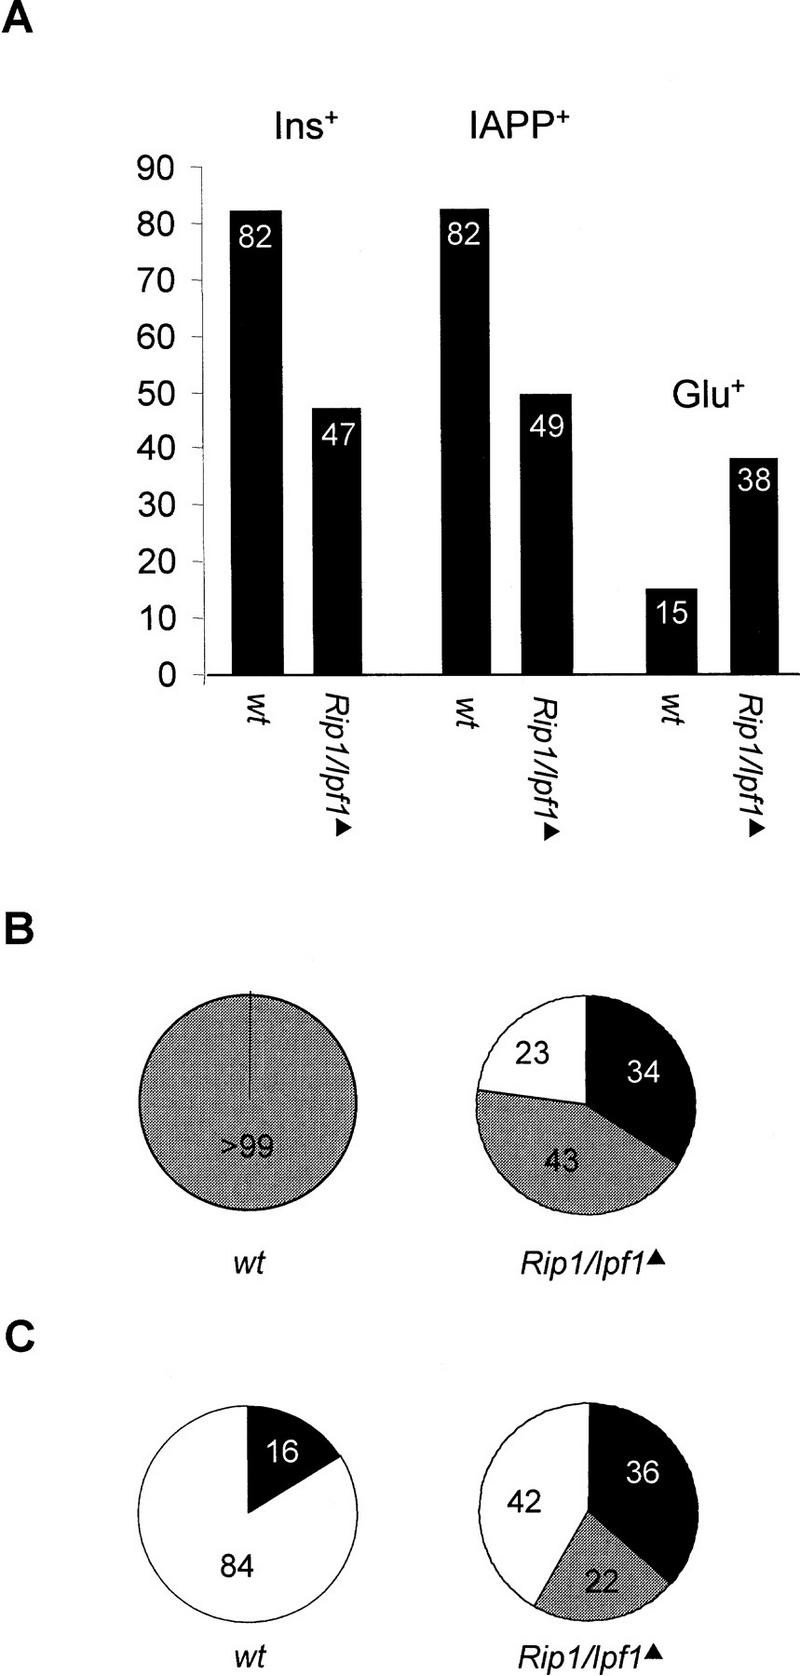
Figure 2.

Rip1/Ipf1▴ mice show abnormal islet composition. (A) The distribution of insulin (Ins+)-, IAPP (IAPP+)-, or glucagon (Glu+)-expressing cells per total number of islet cells in wild-type and Rip1/Ipf1 mice. (B) Ratio of Ins+ to IAPP+ cells in islets from wild-type and Rip1/Ipf1 mice. (Open area) Ins+ only; (solid area) IAPP+ only; (shaded area) Ins+ and IAPP+ coexpressed. (C) Ratio of Ins+ to Glu+ cells in islets from wild-type and Rip1/Ipf1 mice. (Open area) Ins+ only; (solid area) Glu+ only; (shaded area) Ins+ and Glu+ coexpressed. (A–C) n = 600–1050 cells.
