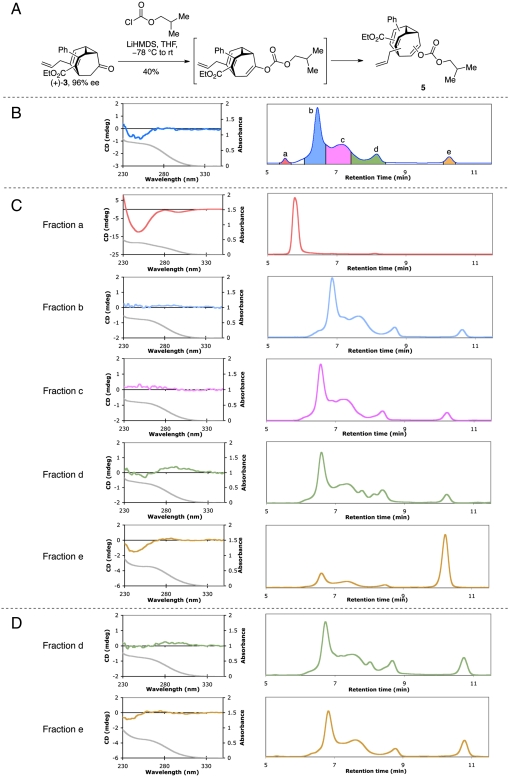
Fig. 4.
Racemization experiment. (A) Preparation of bullvalene. (B) CD Spectrum (Left) and HPLC trace (Right) of column chromatography purified bullvalene 5. Different colors represent fractions collected from preparative HPLC separation. (C) CD spectra and reinjection HPLC traces of fractions a-e 10–12 h after the reaction. (D) CD spectra and reinjection HPLC traces of fractions d and e 24 h and 31 h after the reaction, respectively. Curve shown in gray below each DC spectrum depicts the UV absorption of the corresponding CD sample.

