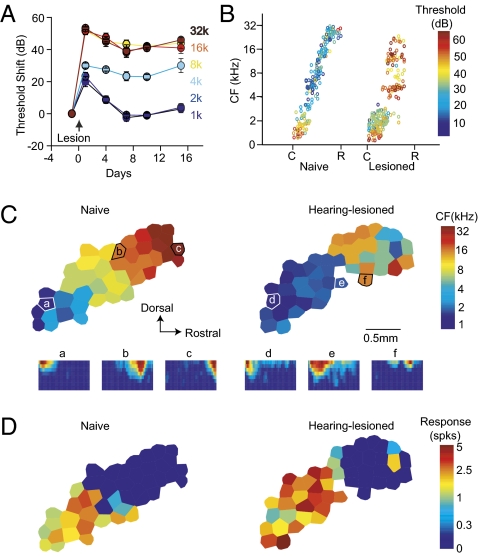
Fig. 1.
Cortical map reorganization after high-frequency hearing loss separates the map into two distinct areas. (A) ABR threshold shift after hearing lesion. (B) CF and threshold (color-coded) as a function of the position along the tonotopic axis. Note the threshold increase for frequencies >4 kHz. C, caudal; R, rostral. (C) Cortical maps and receptive fields in naïve and hearing-lesioned animals. Underneath are receptive fields labeled according to recording sites on the map. (D) Maps of response magnitude to a 2-kHz and 50-dB tone. Both responsive area and response magnitude increased in the hearing-lesioned animal.

