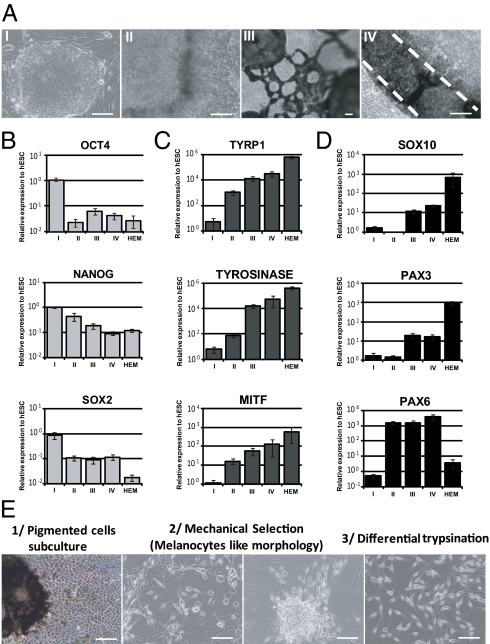
Fig. 1.
Characterization of the hESC pigmentation process. (A) Microscopy analysis of undifferentiated hESCs (step I), hESC-derived cells before and after pigmentation (steps II and III, respectively), and enriched hESC-derived pigmented cells isolated at 60 d (step IV). (Scale bar: 50 μm.) (B) Quantitative PCR analysis of the pluripotency genes OCT4, NANOG, and SOX2 during the hESC pigmentation process. (C) Quantitative PCR analysis of the melanogenesis-related genes TYRP1, TYR, and total MITF during the hESC pigmentation process. (D) Quantitative PCR analysis of the neural crest lineage (SOX10 and PAX3) and neural lineage (PAX6) markers during the hESC pigmentation process. The data are normalized against 18S and expressed as relative expression to undifferentiated hESCs. HEMs were used as a control for adult melanocytes. Each bar represents the SEM (n = 3). (E) Schematic representation of the melanocytic enrichment procedure.

