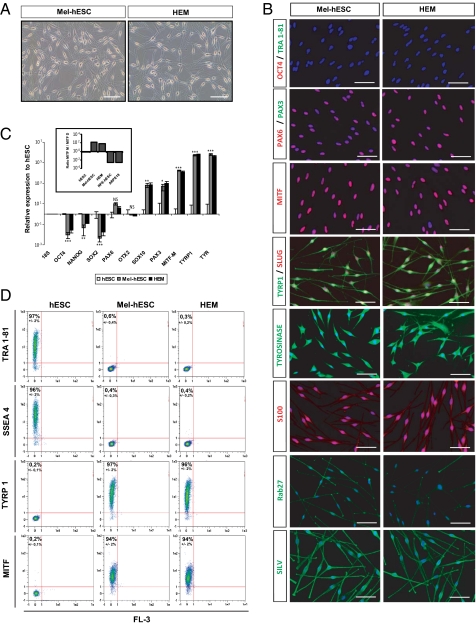
Fig. 2.
Establishment of a homogeneous population of melanocytes derived from hESCs. (A) Microscopy analysis of HEM and mel-hESCs. (Scale bar: 50 μm.) (B) Immunofluorescence analysis of the pluripotency markers OCT4 and TRA1-81; the neural lineage marker PAX6; and the melanocyte markers PAX3, total MITF, TYRP1, SLUG, TYR S100, RAB2, and SILV in mel-hESCs and HEMs. (Scale bar: 50 μm.) (C) Quantitative PCR analysis of OCT4, NANOG, SOX2, PAX6, OTX2, SOX10, PAX3, MITF-M isoform, TYRP1, and TYR in mel-hESCs and HEMs. The data are normalized against 18S and expressed as relative expression to undifferentiated hESCs. Each bar represents the SEM (n = 3). *P < 0.05; **P < 0.01; ***P < 0.001; NS, not significant. Boxed histograms correspond to the ratio of MITF-M and MITF-D isoforms in hESCs, mel-hESCs, HEMs, RPE-hESCs, and ARPE-19 (adult RPE cell line). Each bar represents the SEM (n = 3). (D) FACS analysis of SSEA4, TRA1-81, TYRP1, and MITF in undifferentiated hESCs, mel-hESCs, and HEMs. Each value represents the SEM of three independent experiments. All data presented in this figure were obtained in melanocytes during four passages (approximately 50 d) after their isolation.

