Fig. 3.
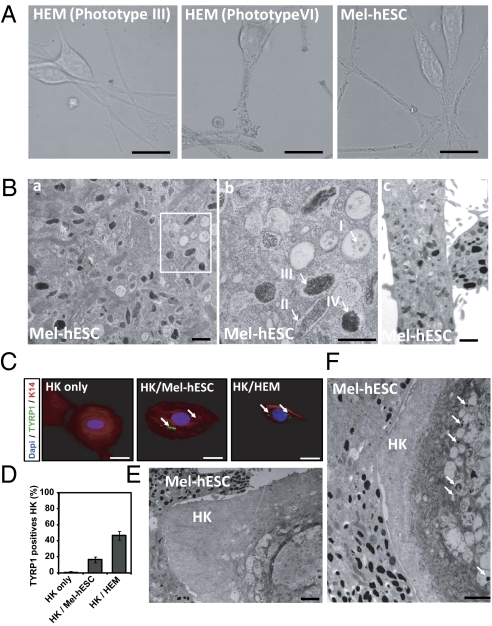
Biogenesis and maturation of melanosomes in melanocytes derived from hESCs. (A) Spinning-disk confocal microscopy was used to capture high-resolution pigmented melanosomes in HEMs (phototypes III and VI) and mel-hESCs. (Scale bar: 5 μm.) (B) EM of mel-hESCs. Characteristic immature and mature melanosomes are observed in the cell soma (a) and processes in the dendrites (c). (b) Higher magnification of the boxed area in a. Arrows represent the different types of melanosomes. (Scale bar: 400 nm.) (C) Immunofluorescence analysis of keratin 14 (K14) and TYRP1 in keratinocytes after 3 d of coculture: without melanocytes (Left), with mel-hESCs (Center), and with HEMs (Right). HK, human keratinocyte. (Scale bar: 10 μm.) (D) ArrayScan automated quantification of the percentage of TYRP1+ keratinocytes after 3 d of coculture with melanocytes (left to right): without melanocytes, with mel-hESCs, and with HEMs. Each bar represents the SEM for three experiments. For each experiment, 100 cells were analyzed. (E and F) EM of a keratinocyte after 3 d of coculture with mel-hESCs. Arrows represent transferred pigment into keratinocytes. (Scale bar: 400 nm.) All data presented in this figure were obtained in melanocytes during four passages (approximately 50 d) after their isolation.

