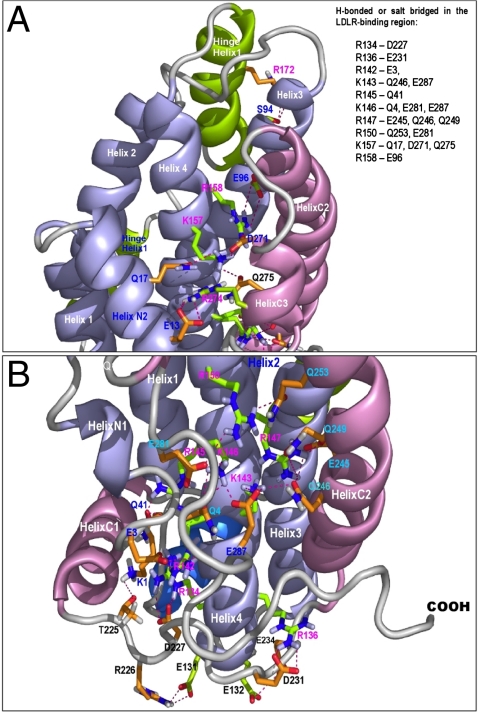
Fig. 2.
Buried H-bonds and salt-bridges between apoE3 domains, with a focus on the major LDLR-binding region. The apoE3 is shown in ribbons and the side chains of the interacting residues in stick model. The NT domain is shown in light blue while the CT domain in pink. The side chains of the interacting residues in the major LDLR-binding region are shown in green, whereas the side chains of the other interacting residues are shown in brown. The salt-bridges and H-bonds are indicated with red dashed lines. (A) Detailed interdomain interactions of residues K157 and R158. (B) Detailed interdomain interactions of residues R134, R136, R142, K143, R145, K146, R147, and R150. The interacting residues are summarized in the top box.

