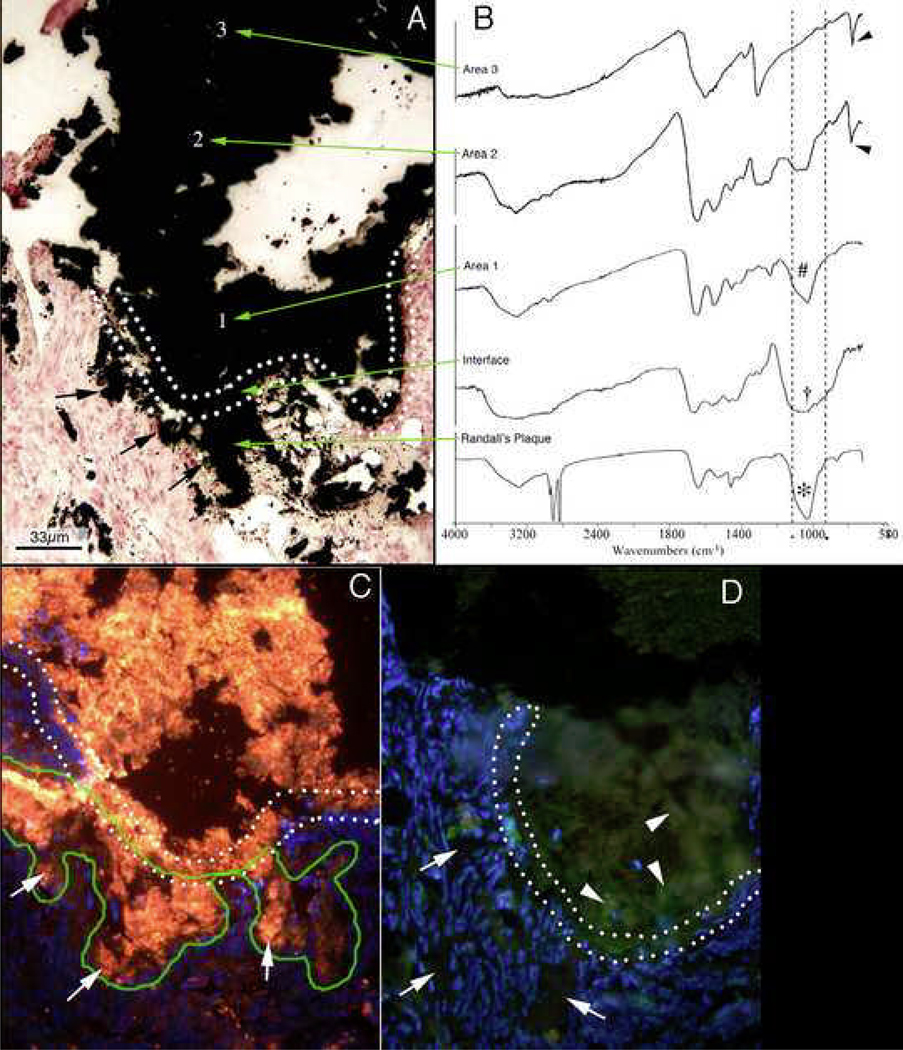
Figure 3. Mineral analysis of attachment site of human kidney stone.
A second stone was removed from another ICSF patient and this stone was processed so that the mineral composition of the stone-plaque interface retained intact so that a precise FTIR analysis could be performed across the interface. The double-doted line in panel A delineates the transition from interstitial plaque to stone. Sites of Randall’s plaque marked by arrows at the lower left side of the panel were confirmed to be composed of hydroxyapatite (lower green arrow in panel B). The region of the interface was composed of amorphous apatite. Region 1 (panel A) was hydroxyapatite while region 2 was a mixture of calcium oxalate and hydroxyapatite. Region 3, a site well within the stone was only calcium oxalate. Immunohistochemistry was used to determine the distribution of osteopontin (panel C) and Tamm-Horsfall protein (panel D) in sites of Randall’s plaque (outlined by a green line) in the tissue, through the interface region (outlined with the double dotted lines) and into the three areas of the stone. Panel C is a serial section to panel A. Note the presence of osteopontin (stained orange) in the interstitial plaque (arrows), interface and all three areas of the stone. Tamm-Horfall protein (stained green) was only found in the stone (arrowheads).

