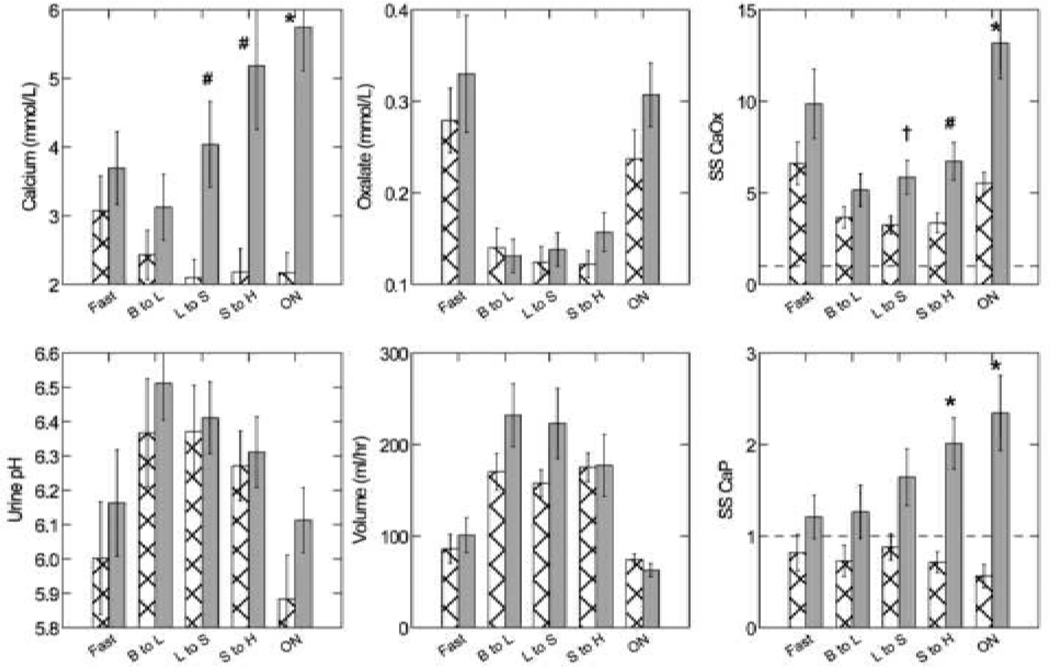
Figure 4. Urine Measurements in idiopathic calcium stone formers ICSF).
Urine molarity of calcium (Upper left and middle panels) among ICSF (Grey solid bars) exceed normals (crosshatch) in the intervals from lunch to supper (L to S), supper to home (S to H) and overnight (ON). Oxalate molarity (upper middle panel), urine pH (lower left panel), and urine volumes (lower middle panel) do not differ between groups. SS CaOx and CaP are higher among ICSF vs. normal at multiple periods (+, p<0.05; #, <0.01; *, p<0.001. Note that normals never exhibit SS values above 1 for CaP whereas values above 1 are common among ICSF.

