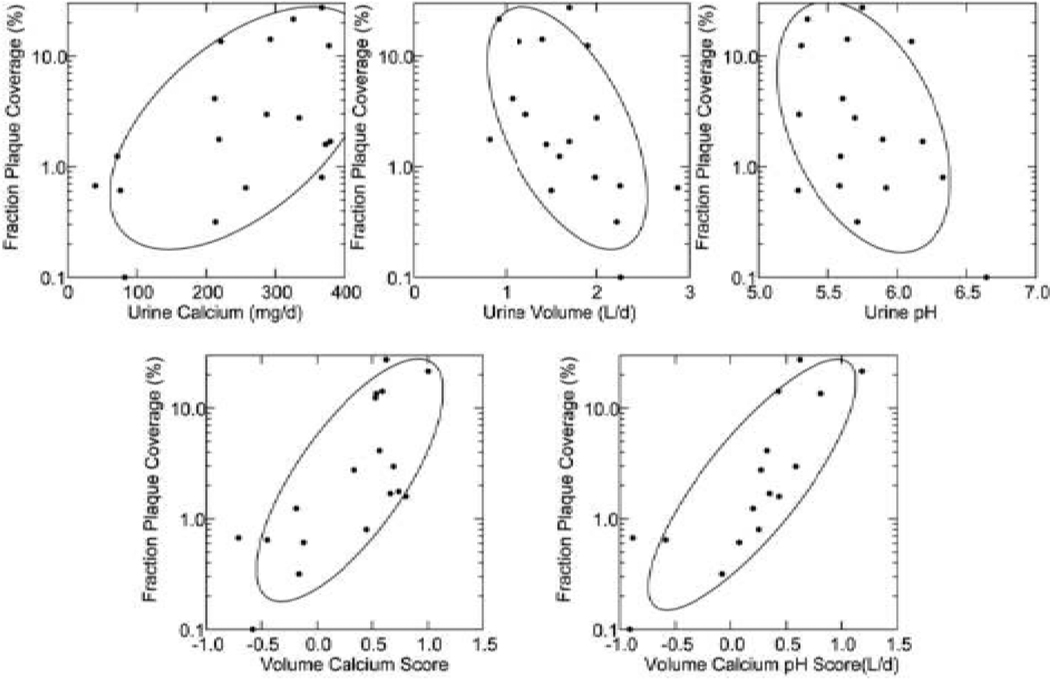
Figure 5. Relationship between plaque abundance (Y-Axes of each panel) and urine measurements.
Plaque area is proportional to urine calcium excretion and inverse to volume and pH (upper panels); multivariate scores using calcium and volume or all three variables (lower panels) account for much of the variation in plaque.

