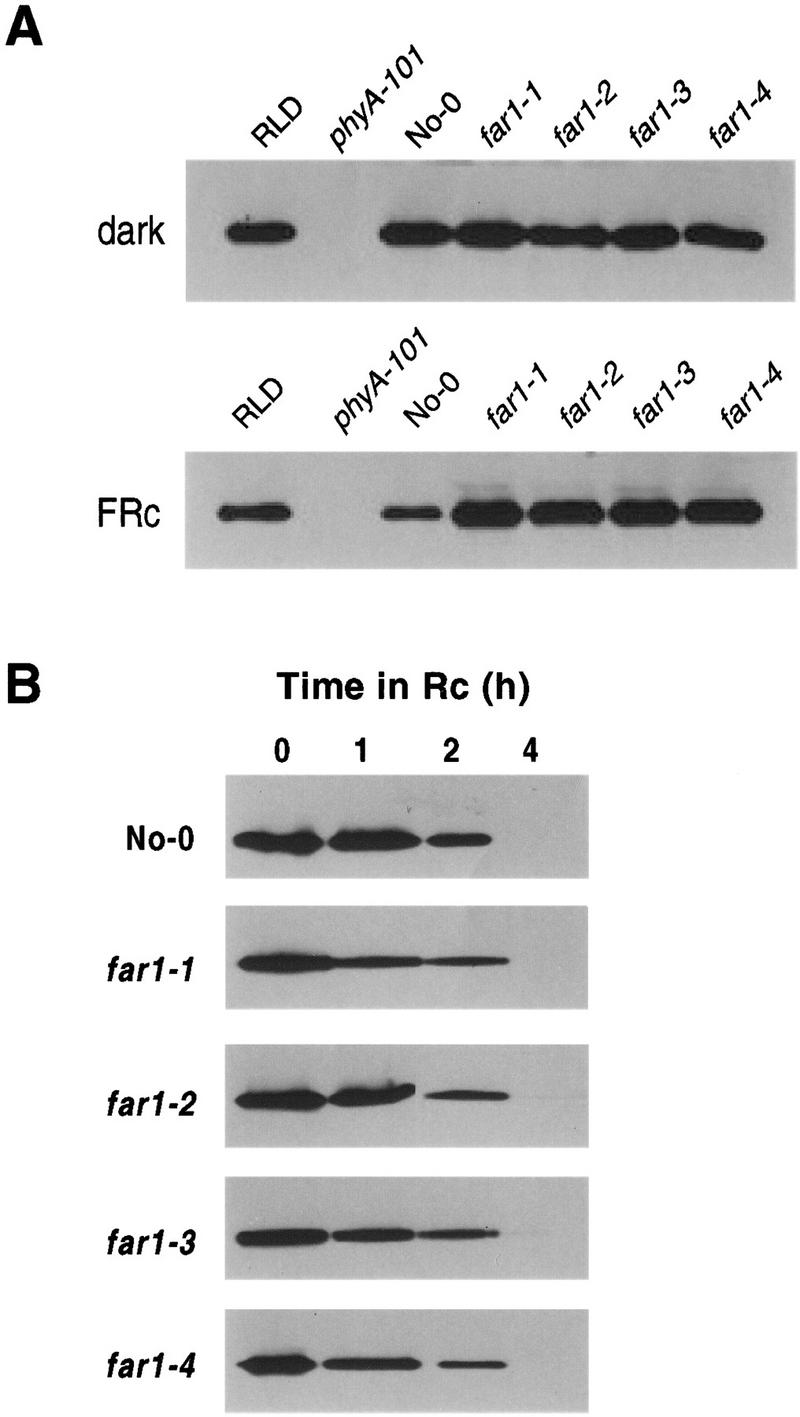
Figure 3.

Phytochrome A levels in the far1 mutants. (A) Steady-state phyA levels measured by protein blot. The figure shows the bands detected by the phyA-specific monoclonal antibody 073D (Hirschfeld et al. 1998). Protein loading was equalized by Bradford assay, and is identical within each panel. Seedlings were grown for 3 days in the dark (top) or under FRc (10 μmoles/m2 per sec) (bottom). Bottom lanes contain 1.5× the protein loading of the top blot. (B) Time course of phyA loss in response to Rc. Seedlings of the four far1 mutant alleles and the wild type (No-0) were grown for 2 days in darkness, then subjected to 0, 1, 2 or 4 hr of RC (16 μmoles/m2 per sec) before protein extraction. PHYA protein was assayed as above.
