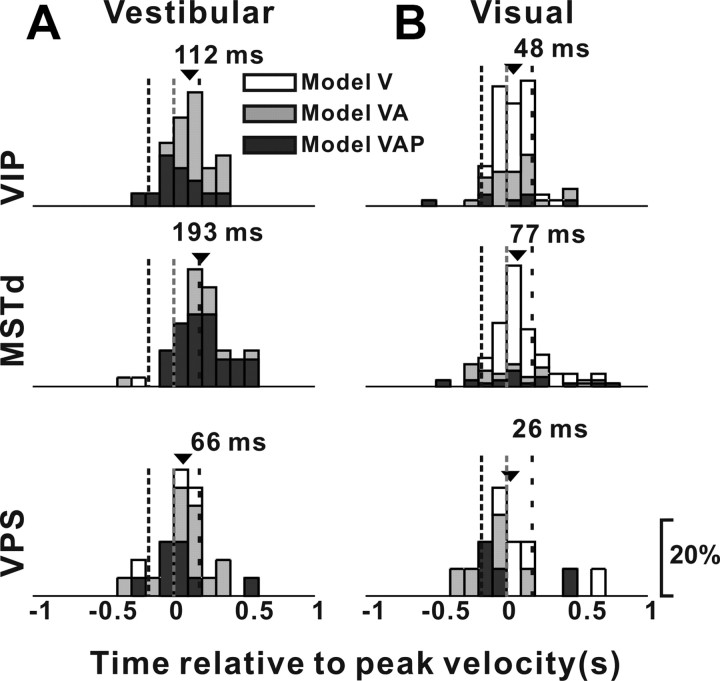
Figure 15.
Distributions of response latency, derived from model fits, for neurons in VIP (top row), MSTd (middle row), and VPS (bottom row), as tested under the vestibular (A, VIP, n = 30; MSTd, n = 48; VPS, n = 24) and visual (B, VIP, n = 76; MSTd, n = 119; VPS, n = 14) conditions. Open bars, Cells better fit with model V; gray bars, cells better fit with model VA; black bars, cells better fit with model VAP. The arrows indicate mean values. The vertical dashed lines indicate the times of peak acceleration/deceleration and peak velocity of the stimulus.

