Figure 2.

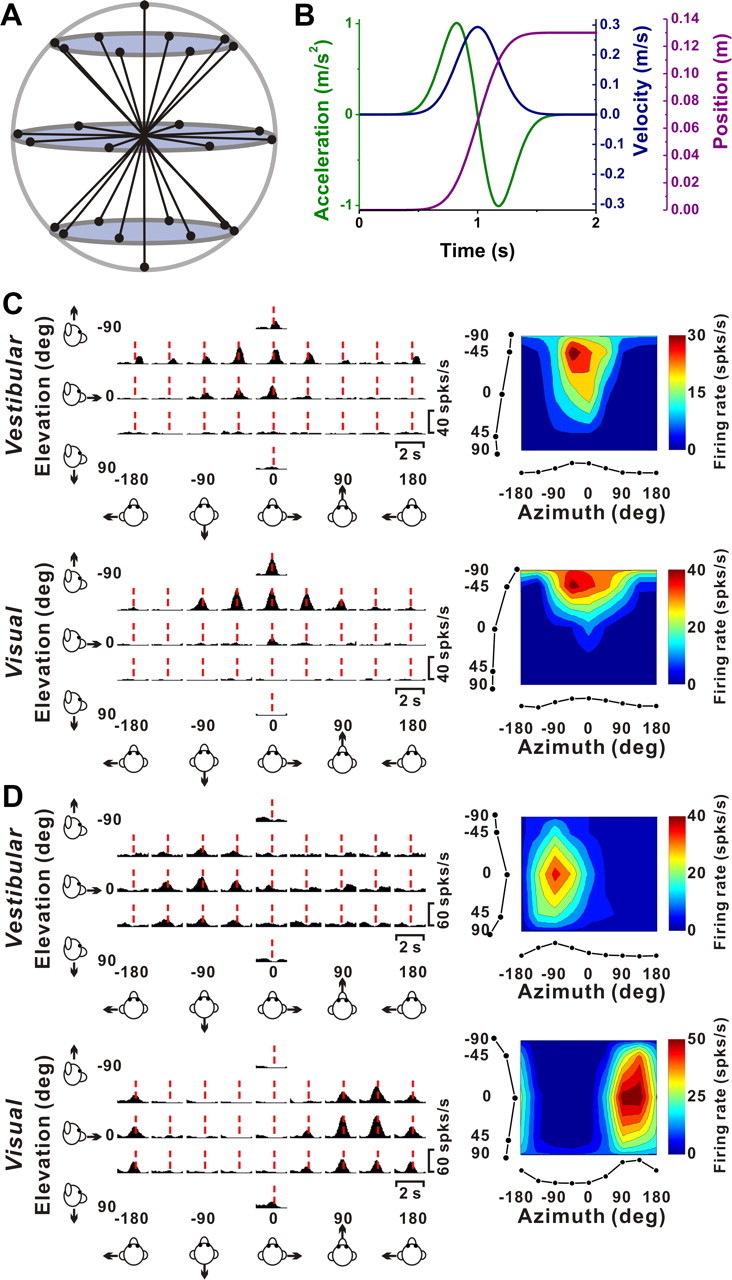
Stimuli and examples of 3D translation tuning. A, Schematic of the 26 movement trajectories in 3D, spaced 45° apart in both azimuth and elevation. B, The 2 s translational motion stimulus: velocity (blue), acceleration (green), and position (magenta). C, Response PSTHs (left panels) and 3D tuning profiles (right panels) for a congruent VIP neuron. The red line indicates the peak time (tvestibular = 1.04; tvisual = 0.91 s) when the maximum response across directions occurred. The 3D tuning profile (right) is illustrated as a color contour map (Lambert cylindrical projection), taken at the peak response time (vestibular DDI, 0.77; visual DDI, 0.87). Tuning curves along the margins of the color map illustrate mean firing rates plotted versus elevation or azimuth (averaged across azimuth or elevation, respectively). The preferred directions for this cell (computed as vector sum) are [azimuth, elevation] = [−24, −38°] for the vestibular condition, and [−6, −64°] for the visual condition. D, PSTHs and spatial tuning profile for a VIP neuron with opposite direction preferences in the vestibular ([azimuth, elevation] = [−64, 7°]; DDI, 0.64; peak time, 0.94 s) and visual conditions ([129, 7°]; DDI, 0.75; peak time, 1.06 s).
