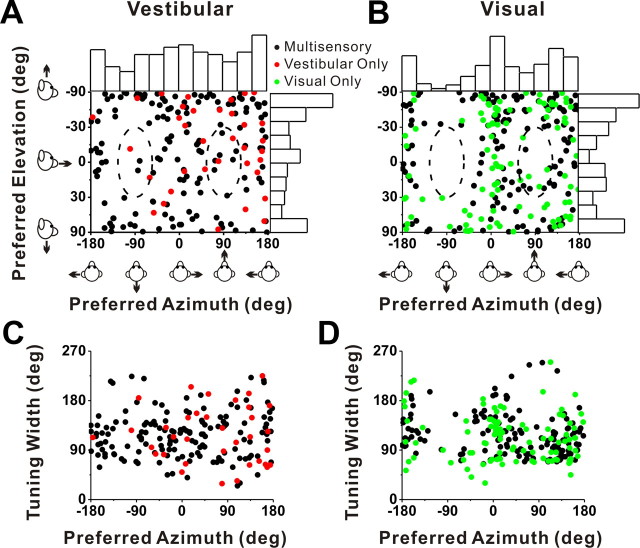
Figure 4.
Summary of direction tuning properties of VIP neurons during translation. A, B, Distribution of vestibular (A) and visual (B) 3D heading preferences. Each data point in the scatter plot corresponds to the preferred azimuth (abscissa) and elevation (ordinate) of a single neuron with significant unimodal heading tuning (A, n = 184; B, n = 240). The data are plotted on Cartesian axes that represent the Lambert cylindrical equal-area projection of the spherical stimulus space. Histograms along the top and right sides of each scatter plot show the marginal distributions. The dashed elliptical curves represent a ±30° range of directions around straight forward ([azimuth, elevation] = [90, 0°]) and straight backward ([azimuth, elevation] = [−90, 0°]). C, D, Scatter plots of the tuning width at half-maximum of each cell, computed from the tuning curve in the horizontal plane, versus preferred azimuth. The black dots represent cells with significant unimodal spatial tuning during both the vestibular (n = 149) and visual (n = 141) conditions. The red dots represent cells with significant unimodal vestibular tuning only (n = 35). The green dots represent cells with significant unimodal visual tuning only (n = 99).

