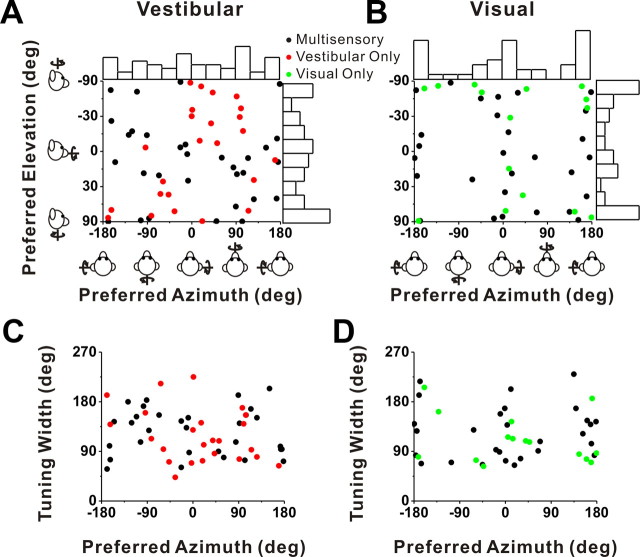
Figure 6.
Summary of tuning properties of VIP neurons during rotation. A, B, Distribution of vestibular (A) and visual (B) 3D rotation preferences. Each data point in the scatter plot corresponds to the preferred azimuth (abscissa) and elevation (ordinate) of a single neuron with significant unimodal heading tuning (A, n = 53; B, n = 43). The format is as in Figure 4. C, D, Scatter plots of the tuning width at half-maximum of each cell versus preferred azimuth. The black symbols represent cells with significant unimodal tuning during both the vestibular (n = 31) and visual (n = 28) conditions. The red symbols represent cells with significant unimodal vestibular tuning only (n = 22). The green symbols represent cells with significant unimodal visual tuning only (n = 15).

