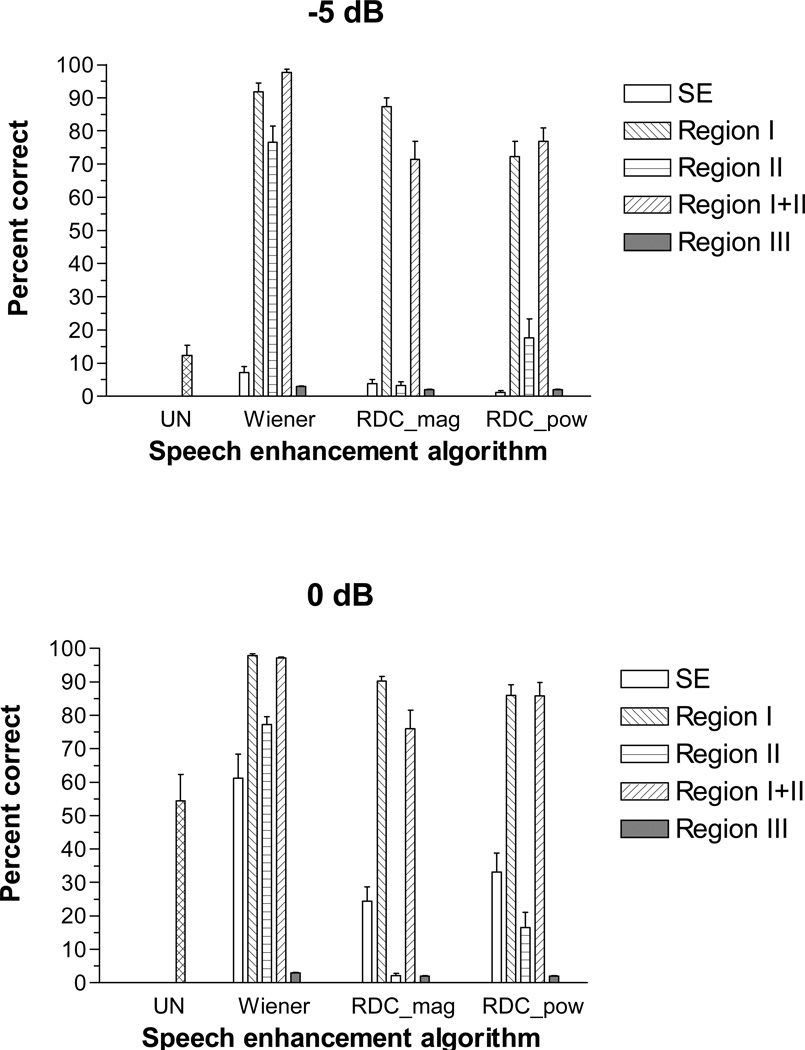
Figure 4.
Results, expressed in percentage of words identified correctly, from the intelligibility studies with human listeners. The bars indicated as “UN” show the scores obtained with noise-corrupted (un-processed) stimuli, while the bars indicated as “SE” show the baseline scores obtained with the three enhancement algorithms (no constraints imposed). The intelligibility scores obtained with speech processed by the three enhancement algorithms after imposing four different constraints are labeled accordingly.

