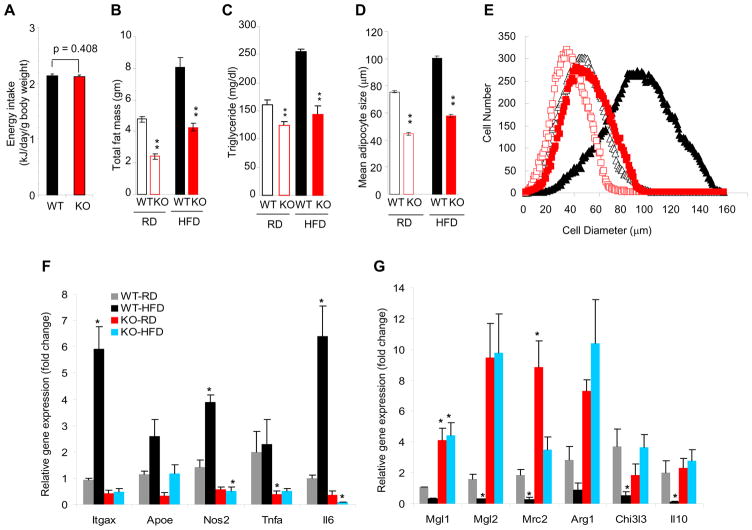
Figure 2. Smad3 deficiency suppresses white adipose tissue differentiation.
a, WT and KO mice intake similar caloric energy as monitored by weekly food intake. b, c, RD-fed or HFD-fed KO mice, harbor reduced fat mass (b) and triglyceride levels (c). d, e, KO adipocytes (red) on a RD (open symbols) or HFD (closed symbols) maintain smaller size compared to WT adipocytes (black). f, g, KO mice fed RD or HFD exhibit significantly reduced levels of inflammatory M1-macrophage specific transcripts (f) and increased levels of protective M2-macrophage specific transcripts (g). *p < 0.05; **, p< 0.005; ***, p<0.001.

