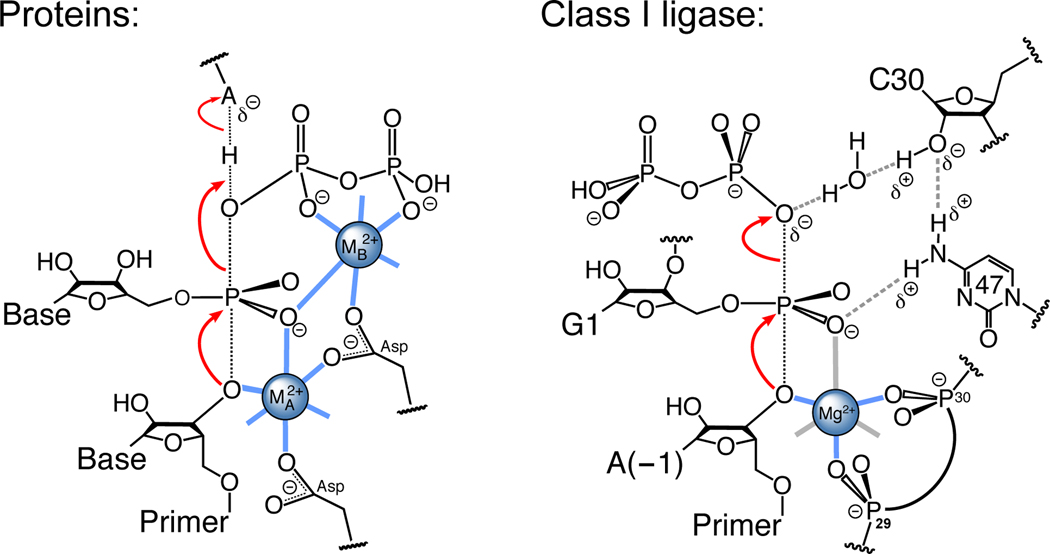
Figure 5.
Transition-state stabilization by protein and RNA active sites. (Left) Catalysis by proteinaceous polymerases28. Black dotted lines indicate bonds formed or broken during the transition state. Red arrows indicate the reaction direction during polymerization. (Right) Catalysis by the class I ligase. Gray dashed lines denote hydrogen bonds. Thick lines denote inner-sphere contacts with a single catalytic metal ion; those in blue are observed crystallographically, those in gray are either inferred from biochemical results or are presumed to be water (not shown). Red arrows indicate the reaction direction during ligation or polymerization.

