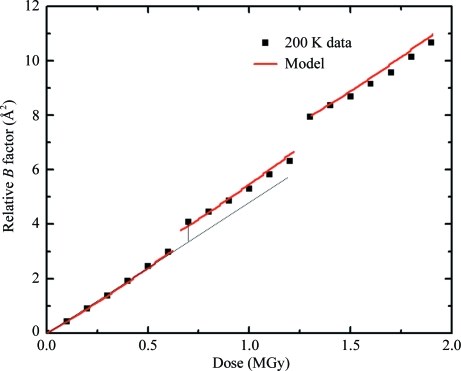
Figure 3.
An interrupted dose curve of relative B factor versus dose acquired at T = 200 K. The time between data points was 40 s. The dark-interval times at each interruption were 240 and 660 s for the first and second interruptions, respectively. The solid line is a fit to the model discussed in §5.3 with α/β = 2 and τ = 240 s. The vertical distance between the dotted line and the data collected immediately after the dark interval determines the amount of dark progression.

