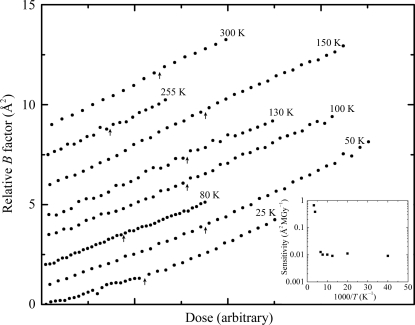
Figure 4.
Interrupted dose curves at temperatures between 25 and 300 K where no dark progression was observed. The time between data points was 40 s. The dark-interval times at each interruption (indicated by the arrows) were 840, 1080, 1320, 1320, 1320, 1080, 600 and 600 s at T = 25, 50, 80, 100, 130 150, 255 and 300 K, respectively. At each arrow, a jump in the curve would indicate the presence of dark progression (as in Fig. 3 ▶), so the absence of jumps indicates that no additional damage was manifested during the dark-interval time. Crystal sensitivity to dose and thus the slope of relative B factor versus dose varies strongly with temperature. The doses for each curve in Fig. 4 ▶ have been normalized to give the same slope and the normalization factor (sensitivity) versus temperature is shown in the inset. The curves are also vertically offset for clarity.

