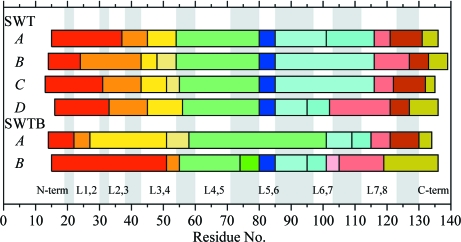
Figure 7.
TLS group boundaries identified for the six streptavidin subunits. Different colored blocks denote different TLS groups identified by the TLSMD server (http://skuld.bmsc.washington.edu/~tlsmd/). Results are shown for ten groups. This figure was drawn with gnuplot v.4.4 (Williams & Kelley, 2007 ▶).

