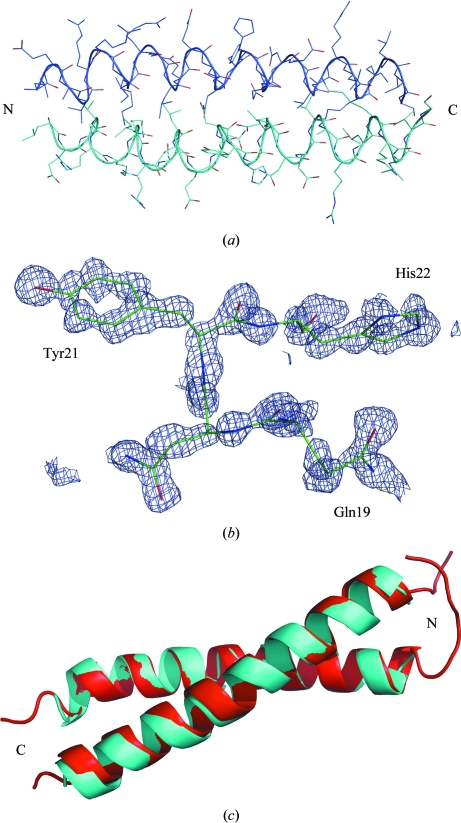
Figure 2.
(a) Structure of αTM1bZip, with the chains shown in different colours. (b) Unbiased simulated-annealed F o − F c OMIT map at a contour level of 2σ calculated after deleting residues 19–22 in chain B. (c) Ribbon model of the chimeric TM peptides in the crystal (blue) and NMR model 1 (red) structures. The images were prepared with PyMOL (DeLano, 2002 ▶)

