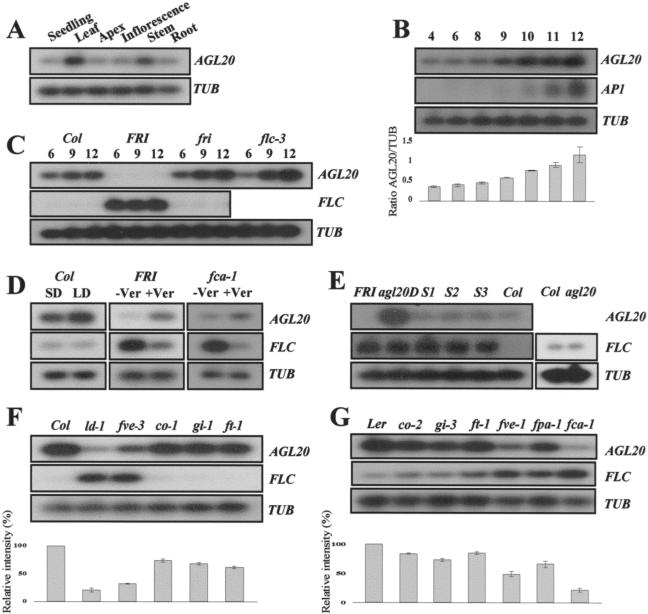
Figure 5.
Analysis of AGL20 expression by RT-PCR. (A) Expression of AGL20 in various organs. (B) A time course of expression of AGL20, FLC, and AP1. Lane numbers indicate days after germination. (C) Comparison of expression levels of AGL20 and FLC in Columbia (Col), FRI FLC (FRI), fri (FN235) FLC (fri), and FRI flc-3 (flc-3). (D) Effect of photoperiod and vernalization on the expression of AGL20 and FLC. To detect FLC expression in Columbia grown under short days and long days, the filter was overexposed. (E) Expression of AGL20 and FLC in agl20-101D FRI FLC (agl20D), 35S::AGL20 FRI FLC (S1, S2, S3), and agl20 knockout mutant. For agl20, the filter was overexposed to detect FLC. (F) Expression of AGL20 in late-flowering mutants in Columbia background. (G) Expression of AGL20 in late-flowering mutants in Ler background. The bar graphs below panels B, F, and G represent the relative expression level of AGL20. Standard deviation obtained from three independent experiments is indicated. The β-tubulin gene (TUB) was amplified as a quantitative control.

