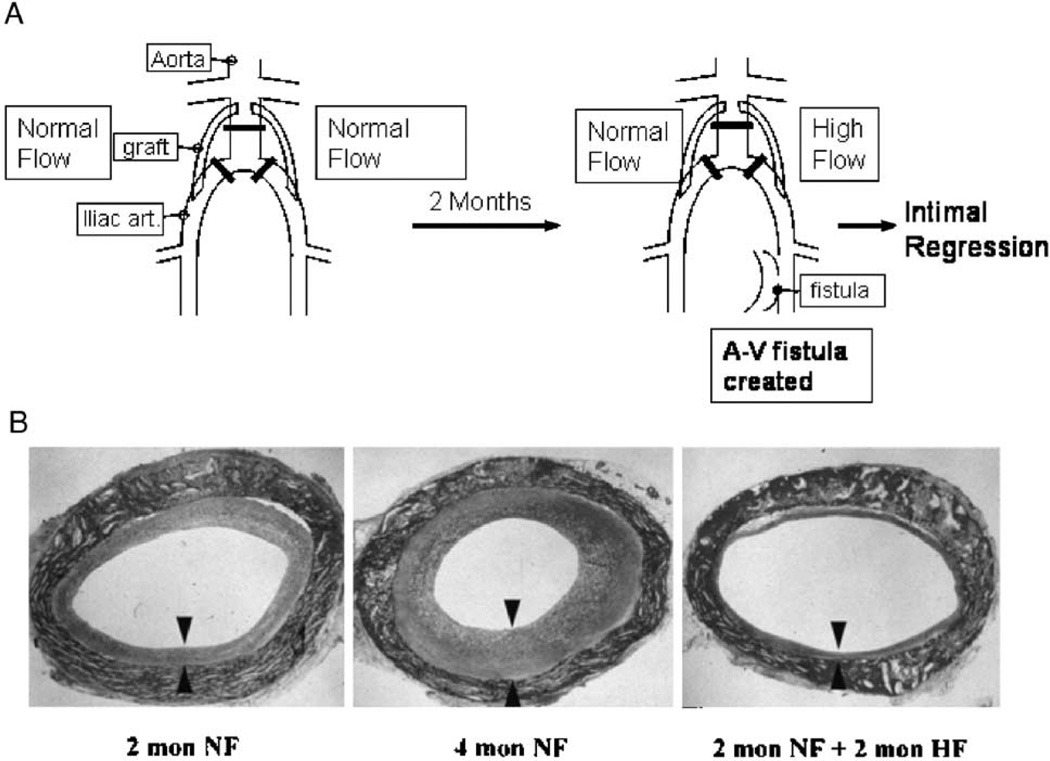
Figure 3.
(A) Schematic of the baboon bilateral aorto-iliac PTFE graft model of high blood flow-mediated intimal regression. (B) Hematoxylin–eosin-stained cross-sections of PTFE grafts after 2 months of normal blood flow (NF; left panel), 4 months of normal blood flow (center panel), and 2 months of normal flow followed by 2 months of high blood flow (HF; right panel). The arrow heads demarcate the neointima (bottom panel from Mattsson et al. 1997 with permission from Lippincott, Williams & Wilkins).

