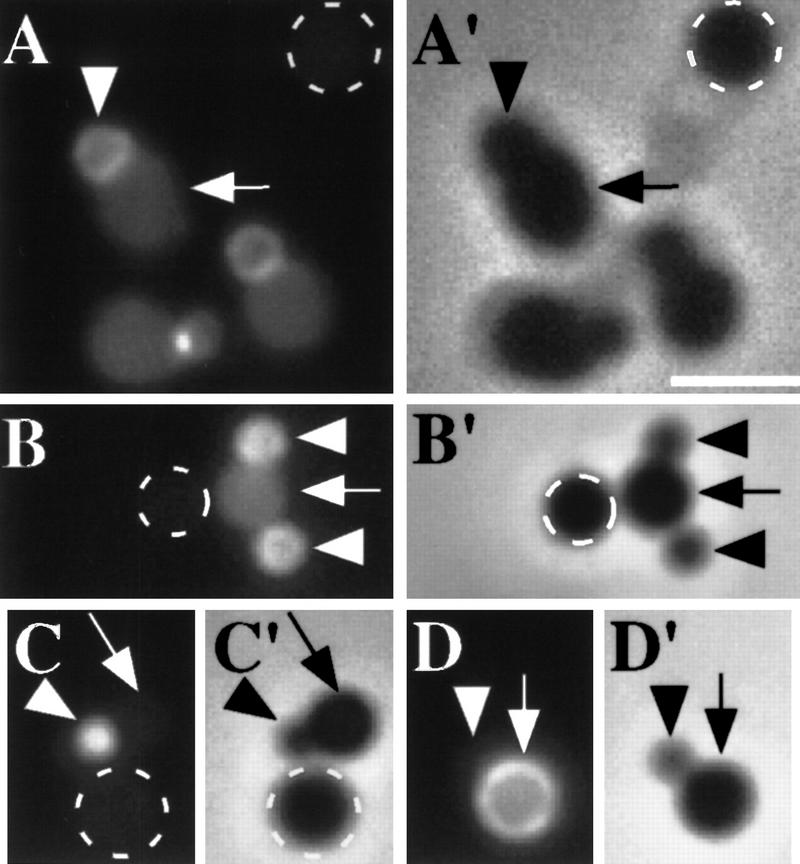
Figure 4.
Distribution of SpoIIE–GFP in protoplasts. Protoplasts were generated by lysozyme treatment of SpoIIE–GFP-producing sporangia of a wild-type (sporulation proficient) strain or a disporic mutant strain in which the coding sequence for a mother cell-specific transcription factor is disrupted (spoIIGB::erm). For comparison, before lysozyme treatment, GFP-producing sporangia were mixed with sporangia lacking a gene fusion. Fluorescence from SpoIIE–GFP is shown in A, B, C, and D with the corresponding phase-contrast images shown in A′, B‘, C‘, and D′. (A) SpoIIE–GFP distribution in protoplasts of wild-type sporangia. (B) SpoIIE–GFP distribution in protoplasts of disporic mutant sporangia. The highest intensity of fluorescence emanated from the forespores, which are marked with an arrowhead. Note, however, that the signal from the mother cells (arrow) is substantially higher than the background of autofluorescence observed in the protoplasts lacking SpoIIE–GFP (broken circle). (C,D) As controls, protoplasts were also generated from cells producing GFP under the control of a σF-dependent promoter (amyE::sspE(2G)–gfp; Webb et al. 1995) (C) and a mother cell-specific promoter (amyE::gfp–spoIVA; Price and Losick 1999) (D). Scale bar, 2.5 μm.

