
Figure 3.
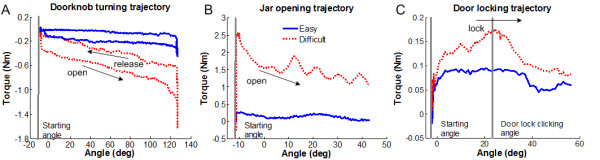
Sample trajectories of functional tasks. Torque versus position trajectories are plotted for three functional tasks in the training session. The blue solid line shows the trajectory of each task at lowest difficulty, which is selected in the first trial of the training session. The red dot line is the trajectory of each task at high difficulty, which is selected near the end of the training session.