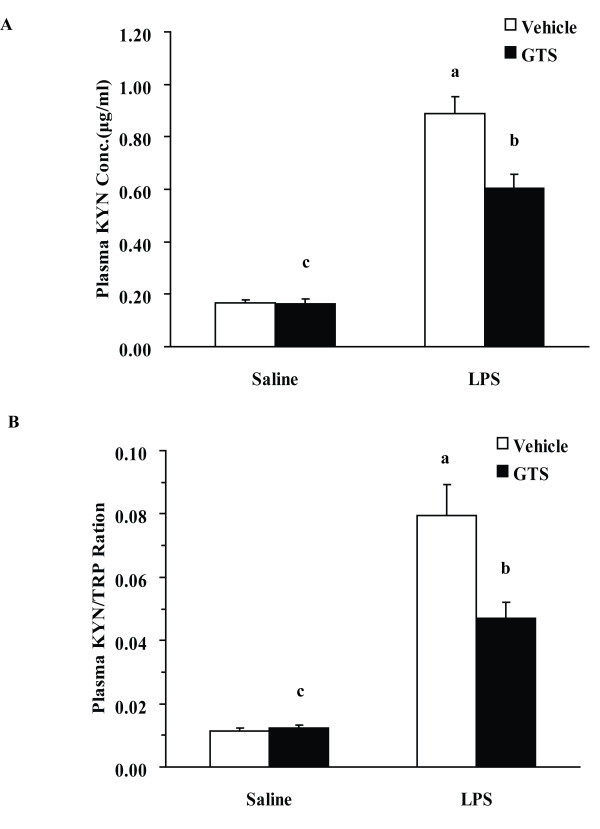
Figure 5.
Effects of GTS on peripheral kynurenine levels and kynurenine/tryptophan ratio. Kynurenine and tryptophan concentrations were determined by high-performance liquid chromatography in plasma (n = 10 mice for each group). The data are expressed as mean ± SEM. For statistical significance, a: p < 0.01 compared with the vehicle/saline group, b: p < 0.05 compared with the vehicle/LPS group. c: p < 0.01 or p < 0.05 compared with the LPS/GTS group.

