
Figure 5.
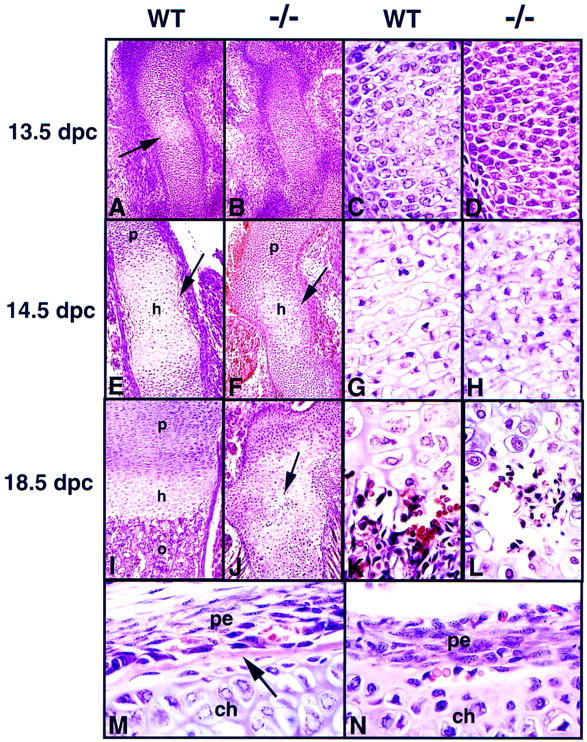
Histological analysis of endochondral ossification in the Ihh mutant. (A, C, E, G, I, K, M) Hematoxylin/eosin-stained longitudinal sections through wild-type humerus. (B, D, F, H, J, L, N) Sections through Ihh−/− humerus. In all the panels except M and N, proximal is at the top, distal at the bottom. (A,B) 13.5 dpc. The arrow in A points to chondrocytes undergoing hypertrophy in the wild-type humerus. (C,D) Higher magnification of chondrocytes in the center of the bones shown in A and B. (E,F) 14.5 dpc. The arrow in E indicates newly formed cortical bone in the wild-type humerus. The arrow in F indicates less mature chondrocytes surrounding the population of hypertrophic cells. (G,H) Higher magnification of chondrocytes in the center of the bones shown in E and F. (I,J) 18.5 dpc. The arrow in J indicates a newly formed site of vascular invasion and degradation of the cartilage. (K,L) Higher magnification of cells at the chondro-osseous junction or the newly formed site of vascular invasion shown in I and J, respectively. (M) Longitudinal section through a wild-type humerus at 18.5 dpc showing the periosteum and the newly formed cortical bone (arrow) adjacent to the zone of hypertrophic chondrocytes. (N) Section through a Ihh −/− humerus at 18.5 dpc showing the abnormal histology of the perichondrium and the absence of cortical bone formation even in vascularized areas. (ch) chondrocytes; (h) zone of hypertrophic chondrocytes; (o) zone of ossification; (p) zone of proliferating chondrocytes; (pe) perichondrium/periosteum.