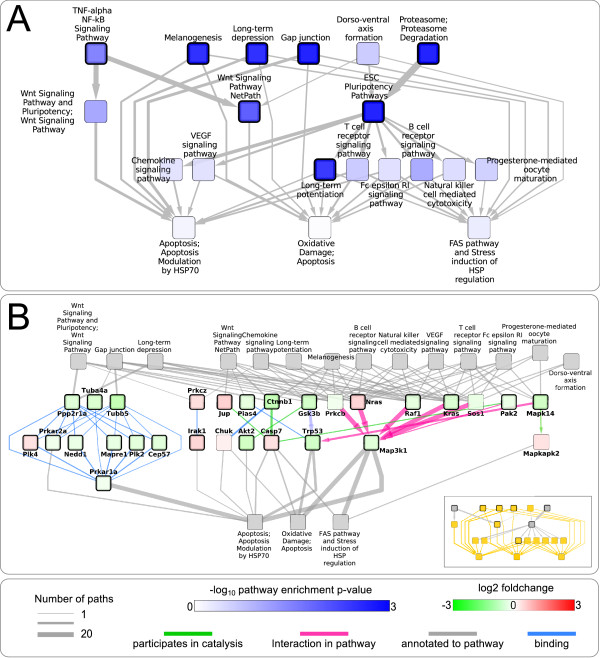
Figure 3.
Pathway interactions and detailed network visualization for the interactions with three apoptosis related pathways for the comparison between HF and LF diet at t = 0. A: Subgraph of the pathway interaction network, based on incoming interactions to three stress response and apoptosis pathways with the highest in-degree. Pathway nodes with a thick border are significantly enriched (p < 0.05) with differentially expressed genes. B: The protein interactions that compose the interactions between the three apoptosis related pathways and their neighbors in the subgraph as shown in box A (see inset, included interactions are colored orange). Protein nodes have a thick border when their encoding genes are significantly differentially expressed (q < 0.05).

