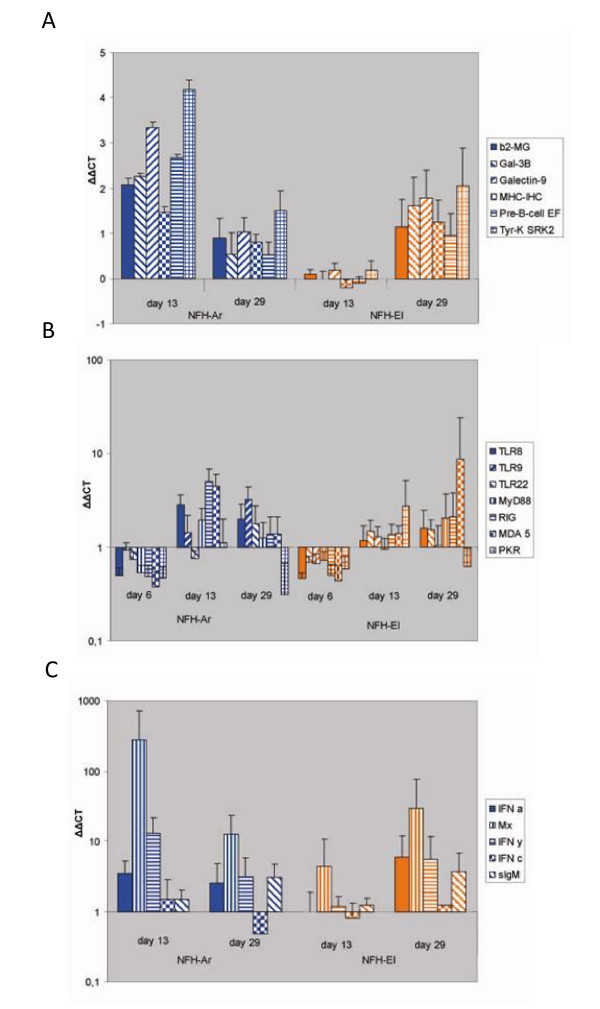
Figure 4.
Regulation of immune pathways in response to infection with the two IPNV isolates analyzed by qPCR. Data are mean fold change in head kidney transcript levels +/- SE from infected fish relative to controls calculated by the ΔΔCT method, adjusted for PCR efficiency and normalized against the elongation factor. A. Validation of microarray results by qPCR on selected immune genes presented in Table 2 (n = 6). B. Expression of pattern recognition receptors, MyD88 and PKR analyzed in 8 fish per strain at each time point. C. Expression of genes involved in innate immunity/IFN signaling and sIgM analyzed in 8 fish per strain at each time point.

