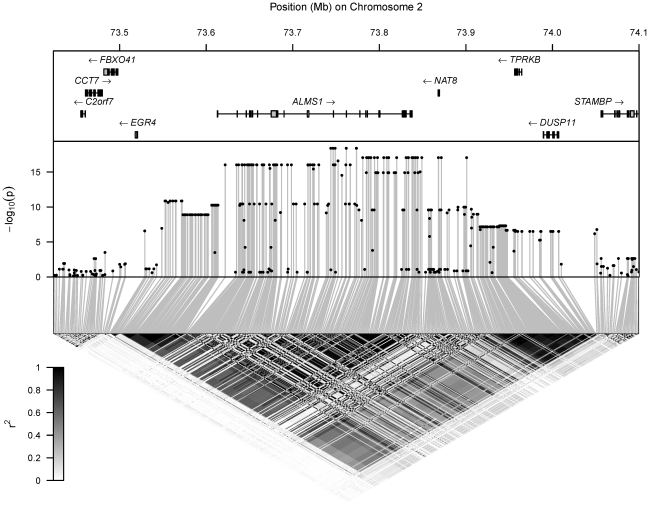
Figure 1. Hit region for N-ACu.
Top: location of genes, with rectangles denoting the position of exons. Middle: log-transformed p-values ( ) for the test of association of the metabolite's concentration with each SNP in the region. Bottom: LD between each pair of SNPs in the region, with the colour scale for
  superimposed.

