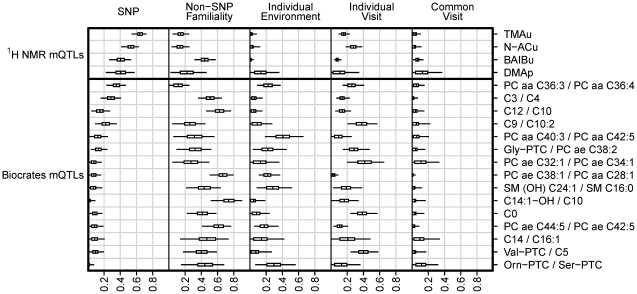
Figure 4. Biological variance decomposition for metabolic traits driven by mQTLs featuring in the current paper.
Results from the current paper's replication of [14] on the Biocrates platform are shown in the bottom section of the plot. Results for 1H NMR mQTLs identified in the current study are shown in the upper section. For each metabolic trait (labelled right), the plot displays estimates of the proportion of biological variance explained by five complementary sources (labelled top; see Materials and Methods for explanation), including the mQTL SNP genotypes, familial variation excluding the mQTL SNP variation, individual environmental variation, and two types of visit variation (individual and common). Posterior distributions for proportions are represented as follows: the central tick in a box marks the posterior mean, the ends of a box mark the posterior quartiles, and the whiskers represent a 95% credible interval (extending to the 2.5 and 97.5 posterior percentiles).

