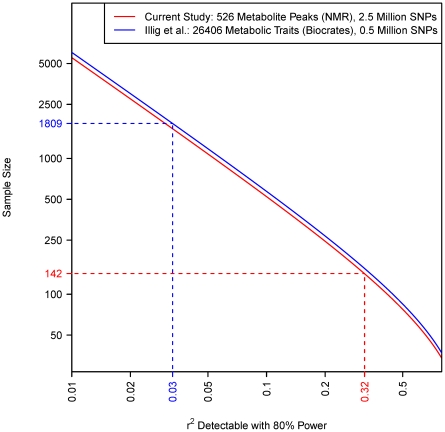
Figure 5. Relationship between sample size and the size of effect detectable with 80% power in each study (shown by solid lines).
The effect size is parameterized by  , which is the proportion of total population variance in metabolite concentration explained by the mQTL genotype (or, equivalently, the squared correlation between genotype and trait). It is assumed that the family-wise error rate in each study is controlled at 0.05 using the Bonferroni method. The number of tests performed is calculated as the product of the SNP and metabolite counts, as shown in the legend. Dashed lines relate the actual sample size of each study to that study's detectable effect size.

