
Figure 6. TMAu's mQTL effect may be mediated by variation in mRNA transcription at PYROXD2.

Each point represents, for a single study participant, their concentration of TMAu (vertical axis), their expression of PYROXD2 in adipose tissue (horizontal axis), and their mQTL genotype (point colour). The intensity data,  , on each of the vertical and horizontal axes have been transformed
 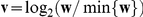 . This transformation sets the minimum observation to zero on log2 scale, and presents log2(fold change) relative to the minimum value.