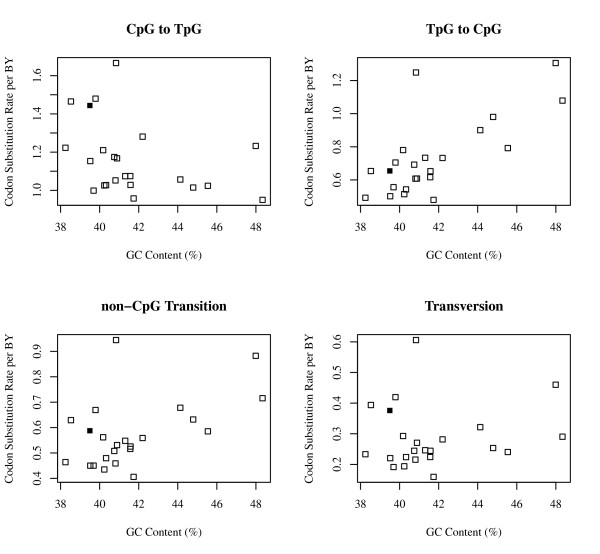
Figure 1.
Scatter plot of CpG and non-CpG substitution rates that are positively correlated to the number of CpG islands per site on the chromosome. Open squares: Synonymous C to T substitution rate at CpG sites on the autosomes. Closed squares: Synonymous C to T substitution rate at CpG Sites on the X chromosome.

