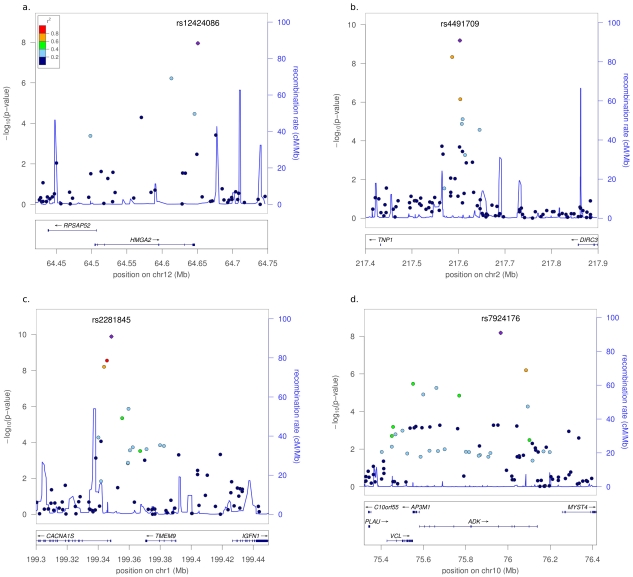
Figure 1. Plots of genetic regions associated with permanent tooth eruption.
The figure shows a) chromosome 12q14.3, b) chromosome 2q35, c) chromosome 1q32.1, and d) chromosome 10q22.2 (generated with LocusZoom [38]). Displayed are the recombination rates over the region and P-values for the analyzed SNPs, the colors indicate the r2 with the most significant SNP.

