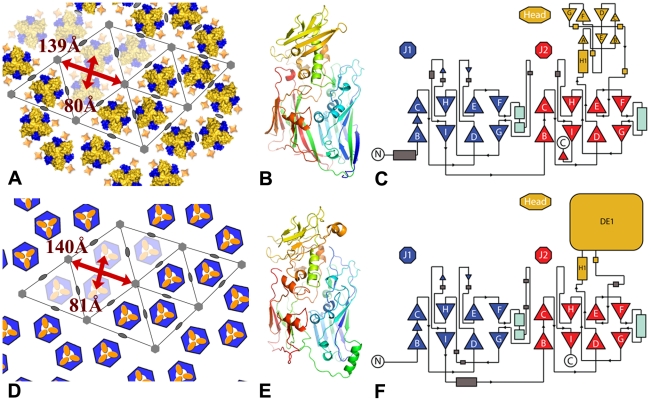
Figure 9. Comparison between the lattices and capsids of vaccinia virus and mimivirus.
(A, D) Honeycomb lattices formed by vaccinia virus D13 and mimivirus P1 respectively. The color scheme is the same as in Figure 5 and the mimivirus capsomer is schematized by a hexagonal base and a head domain colored in blue and yellow respectively [25]. The p6 symmetry is only local and other members of the double-barrel lineage adopt a local p3 lattice with an additional trimer instead of a gap at the 6-fold axis. The positions of the 2- and 6-fold symmetry axes are indicated by ellipses and hexagons. Lattice parameters are indicated in red. (B, E) Analogous views of D13 and a model of the mimivirus P1 capsid protein determined by the Phyre2 server with a blue-red gradient from N- to C-terminus. The confidence is 99.83% with 457 aligned residues sharing 21% sequence identity. The head domain of mimivirus is predicted to be inserted in the J2DE loop like its counterpart in D13 and to share a similar spatial arrangement at the top of the spike. (C, F) Topology diagrams for D13 and P1. J1 and J2 are represented in blue and red respectively, the head domains are shown in yellow. The head domain of P1 is only represented schematically as a box.

