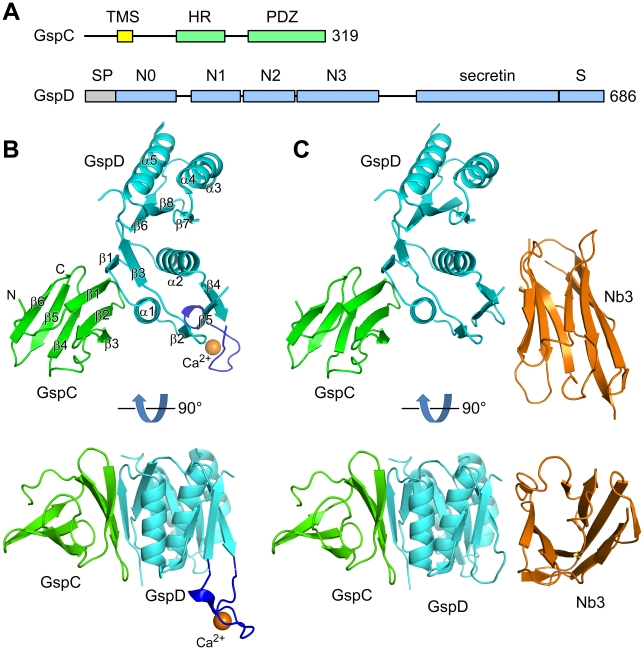
Figure 1. Structures of complexes of ETEC GspCHR and GspD domains.
(A) Schematic diagrams of the domain structures of GspC and GspD. TMS – transmembrane segment; SP – signal peptide. (B) Structure of the GspCHR–GspDN0-N1 binary complex. GspC, GspD and the LBT loop are colored green, cyan and blue, respectively. A Ca2+ ion that occupies the LBT metal binding site is shown as an orange sphere. Secondary structure elements are labeled. (C) Structure of the GspCHR–GspDN0-N1-N2–Nb3 ternary complex. The structure is shown in the same orientation as in (B) for the GspD domains. The orientation of the GspCHR domain with respect to the GspDN0 domain is very similar in (B) and (C). Nanobody Nb3 is colored in orange. The N2 subdomain of GspD is statistically disordered in the crystal lattice (Figure S2). The structure of the GspCHR–GspDN0-N1–Nb3 ternary complex is essentially the same, despite the differences in GspD constructs, crystallization conditions and crystal forms (Figure S3).

