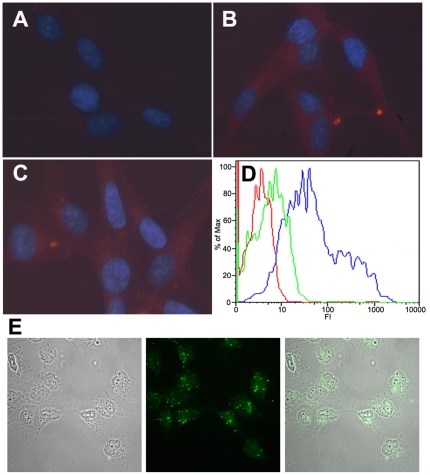
Figure 6. Transport of assembly inhibitor peptides into cells followed by fluorescence microscopy and flow cytometry.
(A, B, C) Representative fluorescence microscopy images of U87-CD4-CXCR4 cells incubated for 3 h at 37°C with with no peptide added (A), or with 10 µg of Rhodamine-labelled CAI (B) or CAC1M (C) in complex with Chariot at a 1∶1 molar ratio. The cell nuclei are stained blue using DAPI; the presence of rhodamine-peptide conjugates is indicated by red fluorescence emission. (D) Flow cytometry analysis of U87-CD4-CXCR4 incubated for 3 h at 37°C with no peptide added (stained with propidium iodide) (red line), 50 µg of FITC-labelled CAI in the absence (green line) or in complex with Chariot at a 1∶1 molar ratio (blue line). (E) Representative fluorescence confocal microscopy images of peptide-transfected cells. NB324K cells were incubated for 3 h at 37°C with 10 µg of FITC-labelled CAI in complex with Chariot (Chariot∶peptide ratio of 1∶1). Left, difference interference contrast image showing the equatorial plane of several cells; center, green fluorescence emission of the same field and focal plane shown at left; right, superimposition of the two previous images, showing the presence of FITC-peptide conjugate inside the cells.

