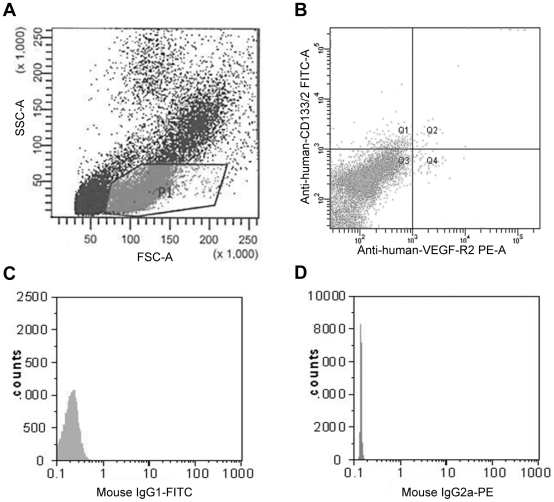
Figure 1. Representative flow cytometry analysis of an EDTA-blood sample from a patient.
Circulating EPCs were identified by the expression of cell surface antigens, such as CD34+, CD133+, and VEGF-R2+. A) Density plot with forward (FSC) and side light scatter (SSC). P1-gate was selected for further analysis. B) Density plot of PE-conjugated anti-VEGF-R2 antibody versus FITC-conjugated anti-CD133 antibody. Cells double positively stained for VEGF-R2 and CD133 (quadrant Q2) represent CD133+ endothelial progenitor cells (CD133+/VEGFR2+ EPCs). C) Mouse-IgG1-FITC negative control and D) Mouse-IgG2a-PE negative control.

