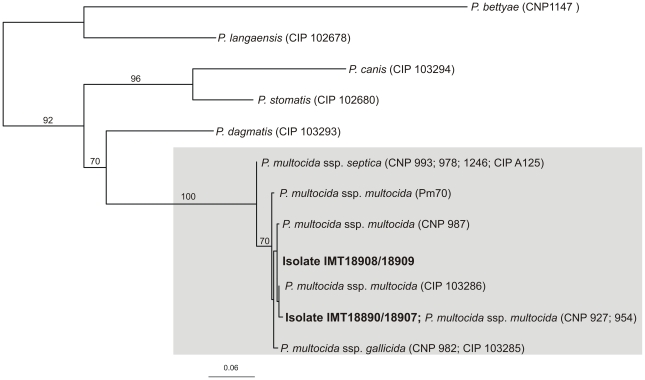
Figure 2. Phylogenetic analysis of the sodA gene.
The tree was built using the maximum-likelihood method from an analysis of sodA sequences (452 bp) from the chimpanzee's isolates and sequences obtained from GenBank. Isolates belonging to the species P. multocida are boxed grey; the chimpanzees isolates are written in bold. Taxon labels indicate species and strain number, including strains with identical sodA sequences (species and subspecies assignments are according to Gautier et al. (2005) [28]). P. langaensis and P. bettyae were used as outgroup. Bootstrap values were calculated with 500 replicates and are given in percent.

